Management and Organizational Studies 3330A/B Lecture Notes - Lecture 1: Ice Cream, Scatter Plot, Cost Driver

26 Dec 2017
School
Department
Professor

Document Summary
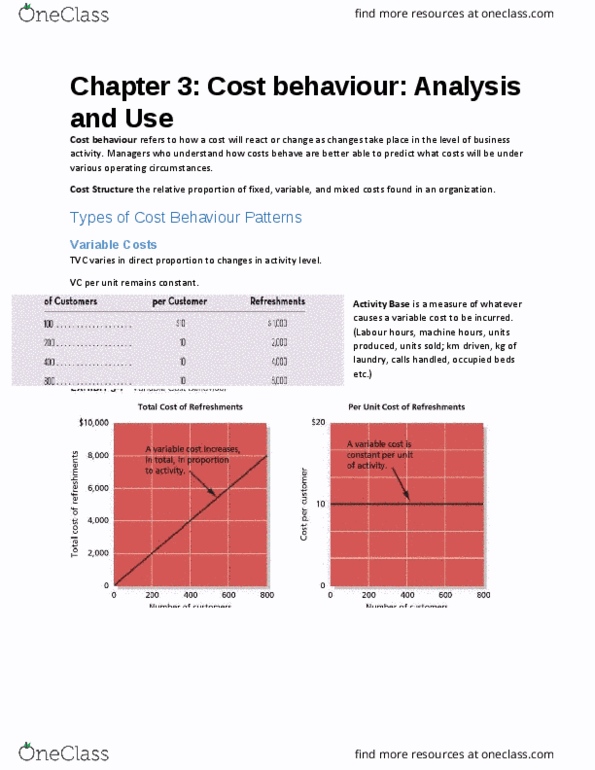
How fixed and variable costs behave and how to use them to predict costs: analyze mixed costs using various approaches, prepare an income statement using the contribution format, analyze a mixed cost using the least-squares regression method. Fixed costs - costs, in total, that remain unchanged within the relevant range as the volume of the cost object varies. Fixed costs do, however, vary on a per unit basis ex. Variable costs - costs, in total, that vary in direct proportion to the changes in the volume of the cost object. Variable costs are, however, fixed on a per unit basis ex. Visual fit (scattergraph) method: visually fit straight line in a scatter plot of data. Determining a cost function: frequently, managers know total costs and activity level (e. g. , production level), and must separate fixed and variable components, to do so, we start with general form of linear equation: