Geography 1100 Lecture Notes - Lecture 9: Leon Festinger, Earth System Research Laboratory, Iceberg

15 Oct 2014
School
Department
Course
Professor
Document Summary
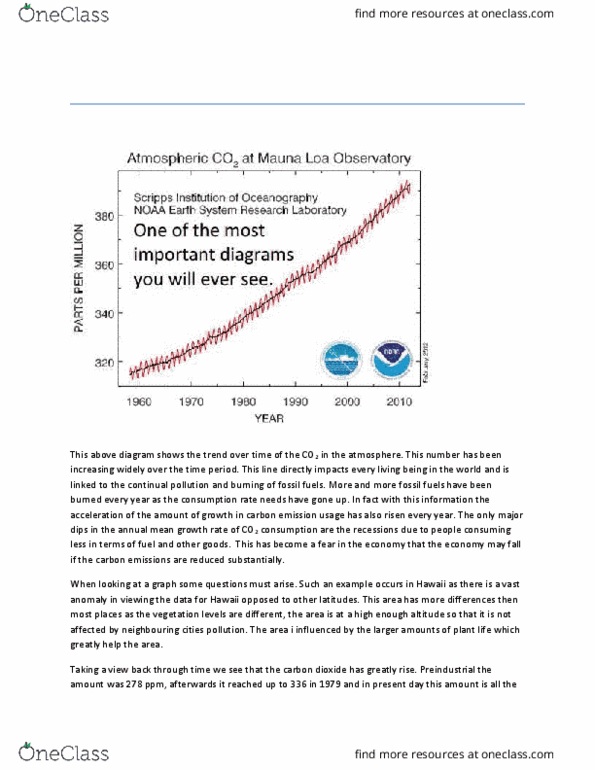
This above diagram shows the trend over time of the co2 in the atmosphere. This number has been increasing widely over the time period. This line directly impacts every living being in the world and is linked to the continual pollution and burning of fossil fuels. More and more fossil fuels have been burned every year as the consumption rate needs have gone up. In fact with this information the acceleration of the amount of growth in carbon emission usage has also risen every year. The only major dips in the annual mean growth rate of co2 consumption are the recessions due to people consuming less in terms of fuel and other goods. This has become a fear in the economy that the economy may fall if the carbon emissions are reduced substantially. When looking at a graph some questions must arise.