Biology 2244A/B Lecture Notes - Lecture 10: Confounding, Scatter Plot, Standard Deviation

1 Jan 2017
School
Department
Course
Professor


Document Summary
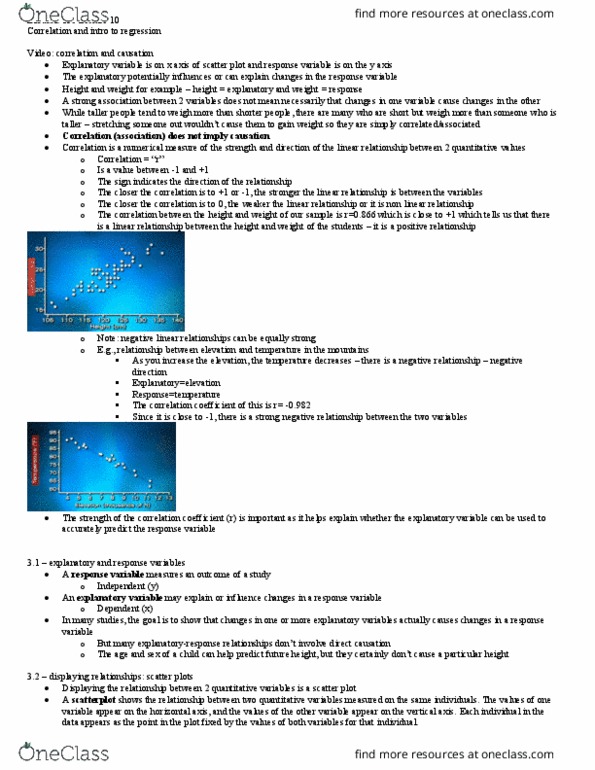
Reading 10 correlation and introduction to regression. Response variable: measures an outcome of a study: dependent variable, depends on the explanatory variable. Explanatory variable: explain or influence changes in a response variable. In many studies, the goal is to show that changes in one or more explanatory variables actually cause changes in a response variable: many explanatory-response relationships do not involve direct causation. Ex. age and sex of a child can help predict future height but they do not cause a. Most statistical studies examine data on more than one variable particular height. Most useful graph for displaying the relationship between two quantitative variables = scatterplot. The strength of a relationship in a scatterplot is determined by how closely the points follow a clear form. Not all relationships have a simple form and a clear direction that we can describe as positive association or negative association.