Biology 2483A Lecture Notes - Lecture 17: Laurasia, Epistle To The Philippians, Primary Succession

30 Jan 2018
School
Department
Course
Professor
Document Summary
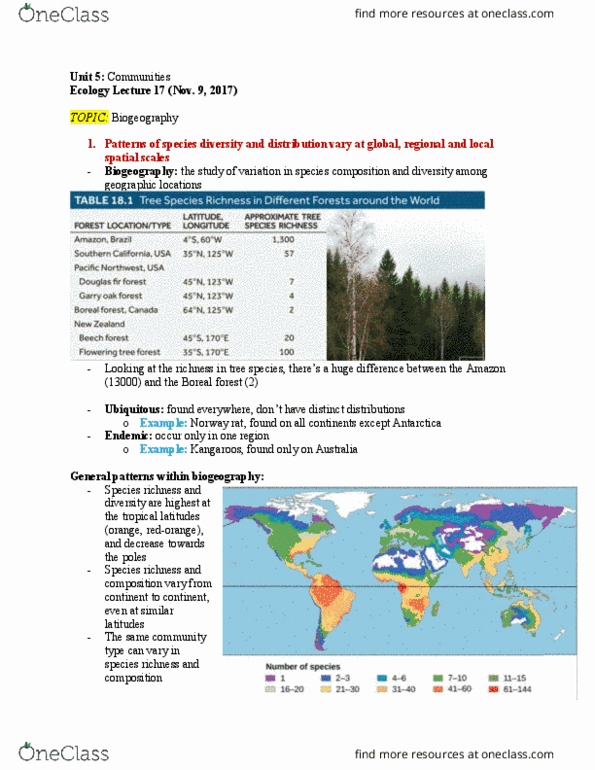
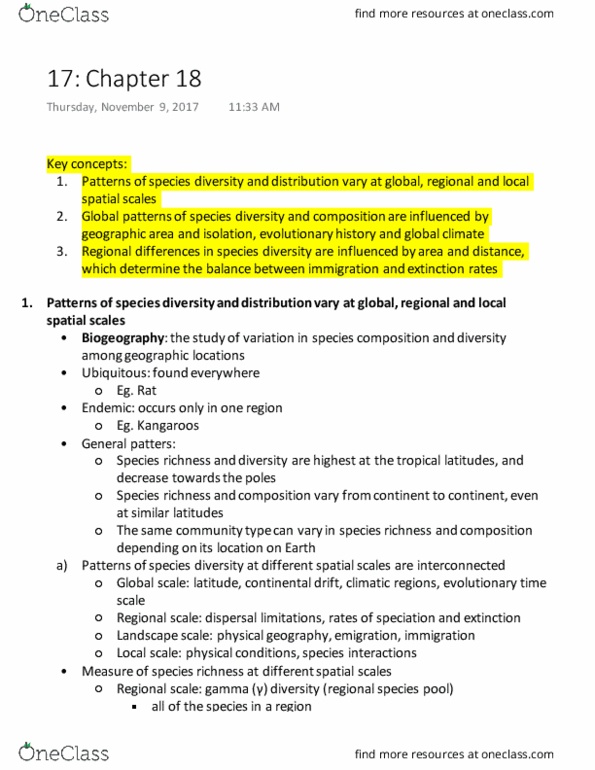
Unit 5: communities lesson 17: biogeography (nov. 9th 2017) Possible species that could be in the community. Landscape scale (cid:271)eta (cid:894) (cid:895) di(cid:448)e(cid:396)sit(cid:455) ratio between regional and local species richness (cid:894) = / (cid:895), diffe(cid:396)e(cid:374)(cid:272)es i(cid:374) (cid:396)i(cid:272)h(cid:374)ess a(cid:373)o(cid:374)g lo(cid:272)al sites. Local scale alpha (cid:894) (cid:895) di(cid:448)e(cid:396)sit(cid:455) average species richness at the local scale. Plot local richness on the y axis and regional richness on the other. If alpha richness = gamma richness, slope is 1. All species found are in all communities. If alpha richness is proportional to gamma richness, slope is < 1. Subset of the total species richness in each community, as regional richness increases, gamma does too. If alpha richness is not proportional to gamma richness, curve reaching plateau. Alpha richness increased initially with gamma richness but plateaued eventually: communities depend on diversity from dispersal of a neighboring community. Could be outcompeted and are unable to establish a population.