Biology 2483A Lecture Notes - Lecture 9: Survivorship Curve, Life Table, Exponential Growth

3 Jan 2018
School
Department
Course
Professor
Document Summary
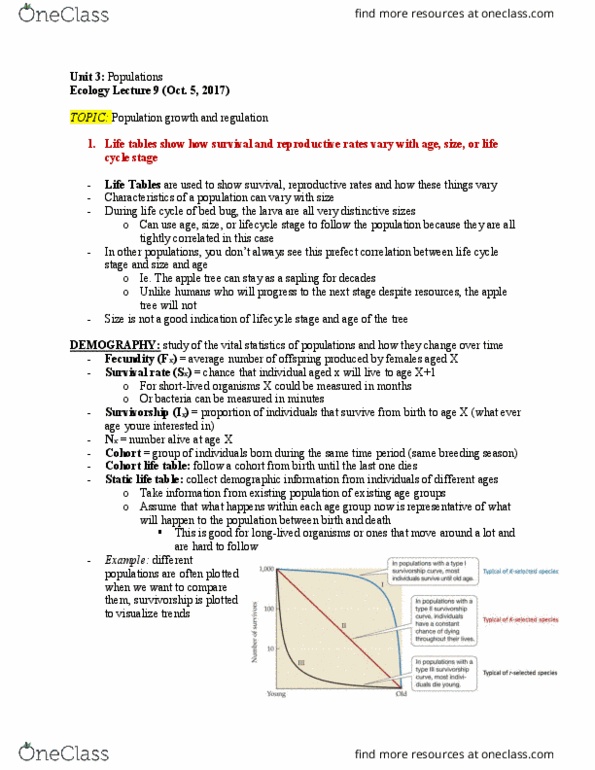
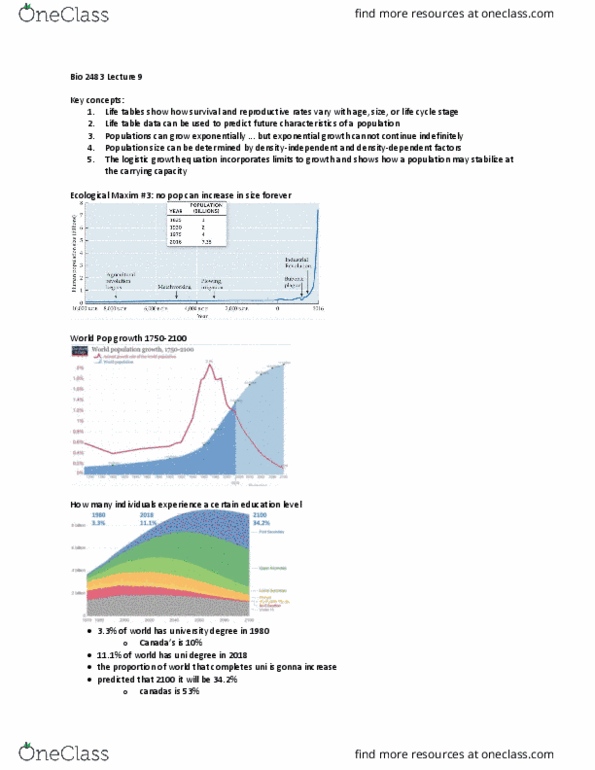
Life tables show how survival and reproductive rates vary with age, size, or life cycle stage. Life table data can be used to predict future characteristics of a population. Populations (cid:272)an gro(cid:449) e(cid:454)ponentiall(cid:455) (cid:271)ut e(cid:454)ponential gro(cid:449)th (cid:272)annot (cid:272)ontinue indefinitel(cid:455) Population size can be determined by density-independent and density-dependent factors. The logistic growth equation incorporates limits to growth and shows how a population may stabilize at the carrying capacity: life tables show how survival and reproductive rates vary with age, size, or life cycle stage. Size: bed bug larva are very distinct sizes in diff stages. Here size, age, and life stage are pretty tightly correlated. In other pops the life cycle stage is not necessarily correlated with size or age. Apple tree: at the small tree stage, individuals could stay as a small tree for decades depending on the resources (not like us) Demography: study of the vital statistics of populations and how they change over time.