STAT 256 Lecture Notes - Lecture 11: Interval Estimation, Covariance, Prediction Interval

3 Apr 2016
School
Department
Course
Professor
Document Summary
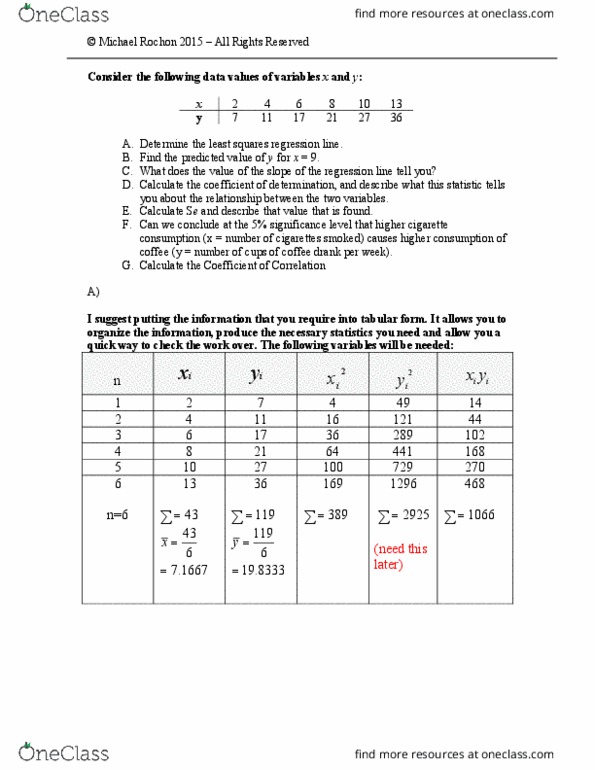
Covariance measures how much two random variables change together. Cov(x, y ) = e [(x x)(y y )] = e(xy ) e(x)e(y ) Pearson correlation coe cient: we use to denote this coe cient. Is estimated by: r = np xiyi p xip yi i (p xi)2ihnp y2 rhnp x2 i (p yi)2i. Example: recall our sh experiment (see the notes for 11. 1 for the data). We found the following summary statistics: i = 170935725 x xiyi = 998815. X xi = 216 x x2 i = 5856 n = 8. Remember: in an observational study you can not conclude causation on the basis of a high level of correlation. Sxx =x(xi x)2 = n np xiyi p xip yi i (p xi)2 i (p yi)2 n. Sy y =x(yi y)2 = np y2 n. Sxx and sy y measure the total variation in the x and y measurements. We can rewrite our estimate for using these sums of squares: