STA221H1 Lecture Notes - Lecture 36: Plastic Surgery, Reality Television, Box Plot

6 Apr 2018
School
Department
Course
Professor
Document Summary
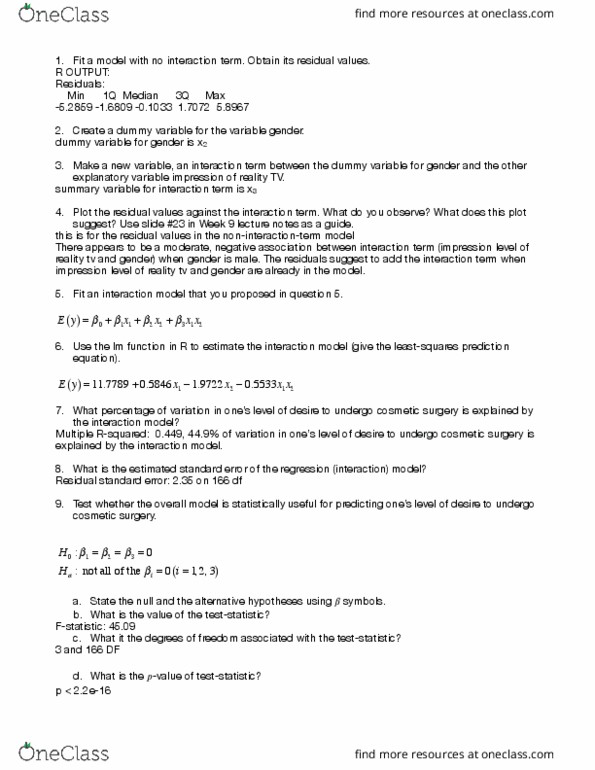
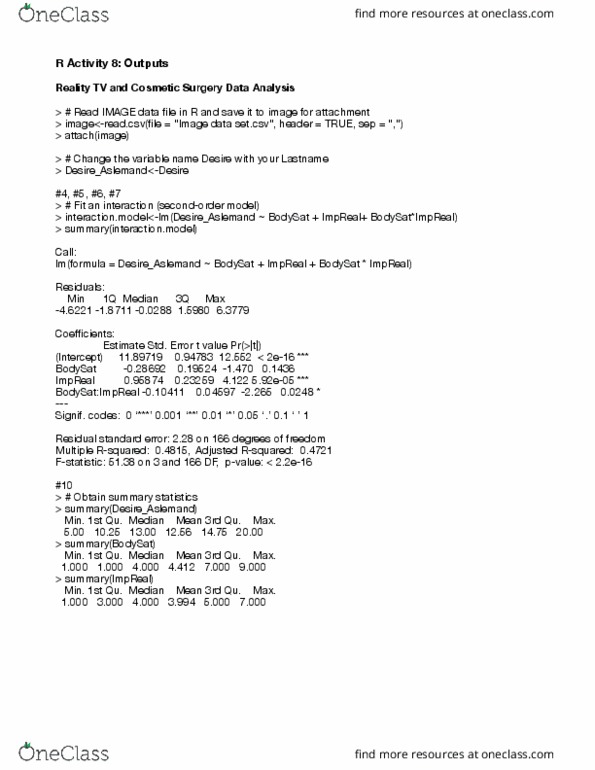
Use the following a = a = k g n k + 1. 2. 36% of the remaining variation is explained by the interaction term, controlling for the other terms in the model. formula (note: = 2): Interpret the estimates of the regression coe cients in the context of this study. 1. 9722: holding impression of reality tv constant, mean desire to undergo cosmetic surgery is. 0. 5846: for a speci ed sex of the person, with every one increase in impression level of reality tv, desire to undergo cosmetic surgery is expected to increase by 0. 5846. That is, let"s assess the overall adequacy of the interaction model t to this data. We will focus on assessing three assumptions regarding normality of random errors, mean zero of random errors, and constant variances of random errors. a. The histogram and box plot shows that the residual values are approximately normally distributed, is relatively symmetrical, and has no outliers.