SOC202H1 Lecture Notes - Lecture 2: Standard Deviation, Interval Ratio, Frequency Distribution

Document Summary
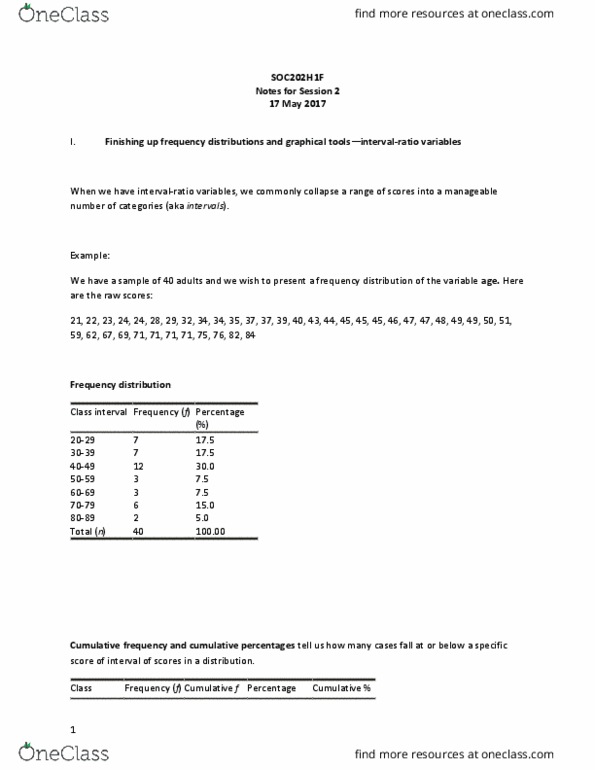
Finishing up on frequency distributions/graphical tools- interval-ratio variables. Continuing on with univariate descriptive statistics: central tendency, dispersion. Measuring the different methods in which people get to class ( nominal variables- there is not inherent ranking) Interval ratio variables present more complexity because there are often many different values these variables can take- especially when the number of cases is large. Ex: body mass index- considered a simple indicator of how heave people are based on their weight. Raw data isn"t very effective to demonstrate the results. We have interval-ratio variables, we commonly collapse a range of scores into manageable number of categories (eg. intervals) To accomplish this, we must decide how many categories are appropriate and how wide the intervals should be. These decisions are up to us as the analysts. Interval width is a function of how wide the range of scores is and how many categories are wished to be included- move the raw data into intervals.