PSY201H1 Lecture Notes - Lecture 2: Graduate Record Examinations, Central Tendency, Frequency Distribution

Document Summary
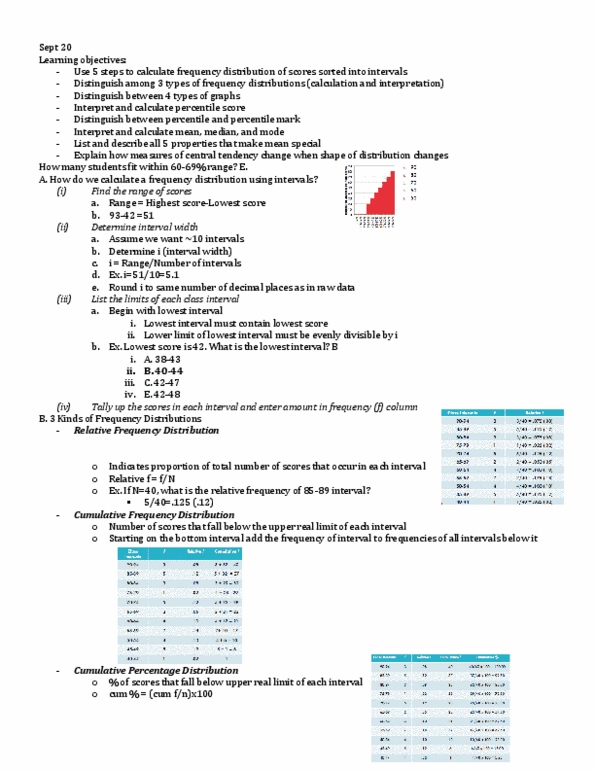
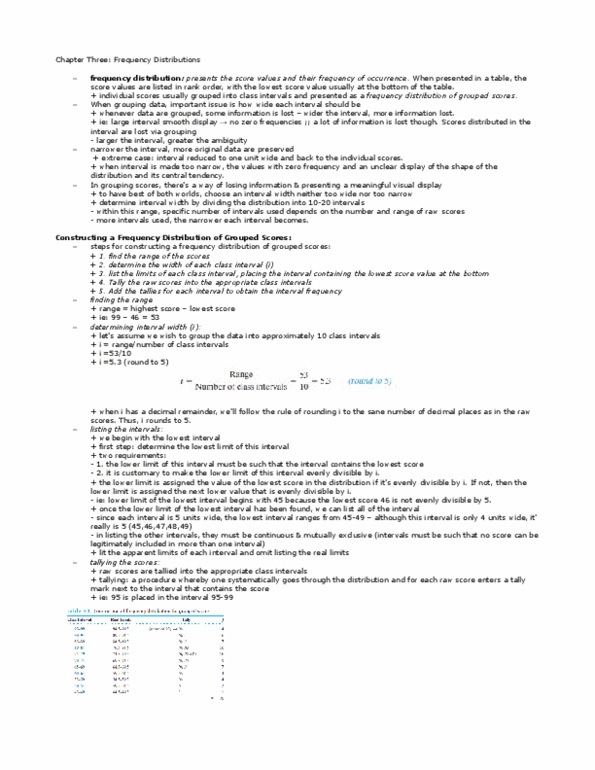
Lecture 2 frequency distribution and measure of central. Frequency distribution allow us to see patterns in the data. Sample of 40 people using human subject pool: n=40. Two measures: questionnaire measures conscientiousness, memory task (max score = 100) Before correlation analysis, investigate distribution of memory scores. Step 1: find the rand of scores: range = highest score lowest score. Step 2: determine the interval width (i: assume we want around 10 intervals, determine i (interval width) i = range/number of intervals i = 51/10 i = 5. 1, round up for down as required. Step 3: list the limits of each class interval: begin with the lowest interval. The lowest interval must contain the lowest score. The lower limit of the lowest interval must be evenly divisible by i. E. g. , lowest score is 42 which is not evenly divisible by 5 so start with 40: lowest score is 42. 3 kinds of frequency distribution: relative frequency distribution.