PSY201H1 Lecture Notes - Central Tendency, Level Of Measurement, Scatter Plot

13 Nov 2013
School
Department
Course
Professor
Document Summary
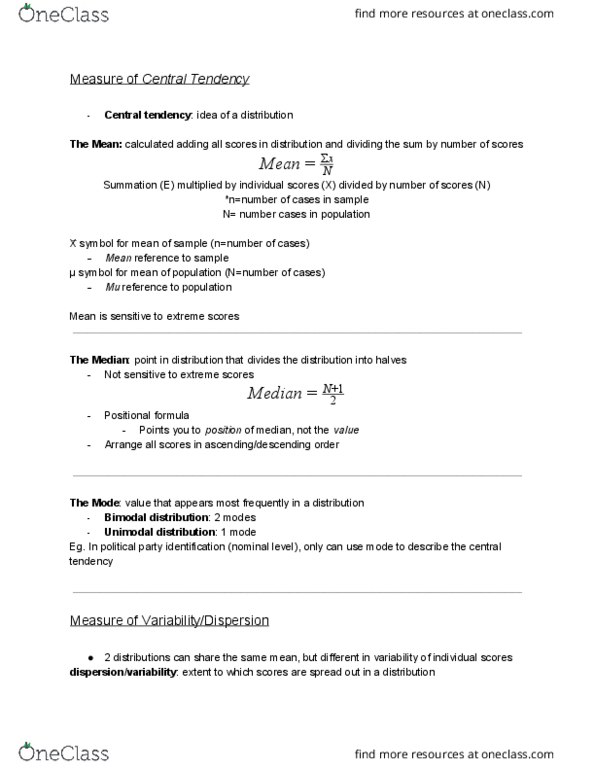
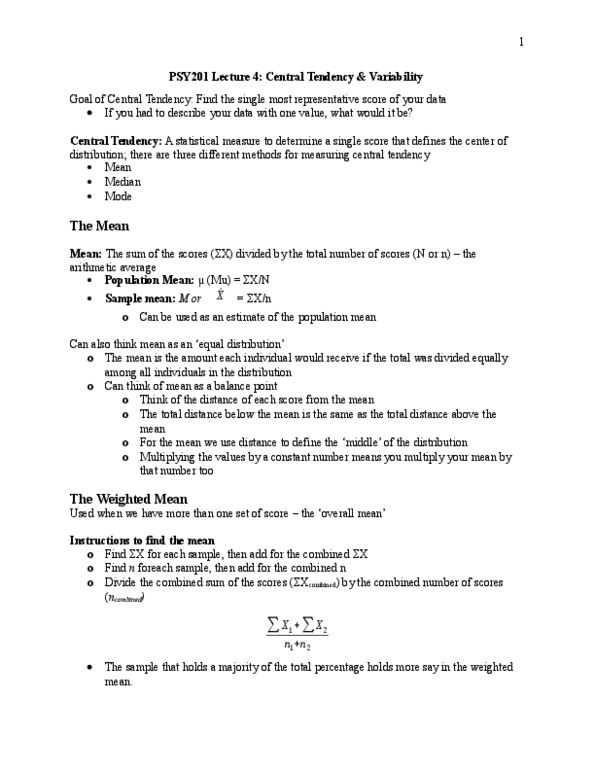
Inferential statistics - using scores from the samples to make generalizations for the whole population; Population - refers to entire group of individuals that interested. Sample - selected group to use for study ; used to make inferences for population. Central tendency - a single value/score that"s the best to describe all; center of the distribution; 3 different methods used in specific situations. Mean - average= x/(n or n); population mean notified as ( = x/n); sample mean - can be used as estimate of pop. Stem and leaf plots- make sure in numerical order. Means usually presented using graphs, used to compare between different groups or conditions, type of graph depends on scale of measurement that was used with the independent variable (nominal/interval) ex. Nominal scale could use a bar graph or histogram; interval scale would need a scatter plot.