STAB22H3 Lecture Notes - Lecture 1: Summary Statistics, European Route E20, Scatter Plot

9 Dec 2015
School
Department
Course
Professor


38
STAB22H3 Full Course Notes
Verified Note
38 documents
Document Summary
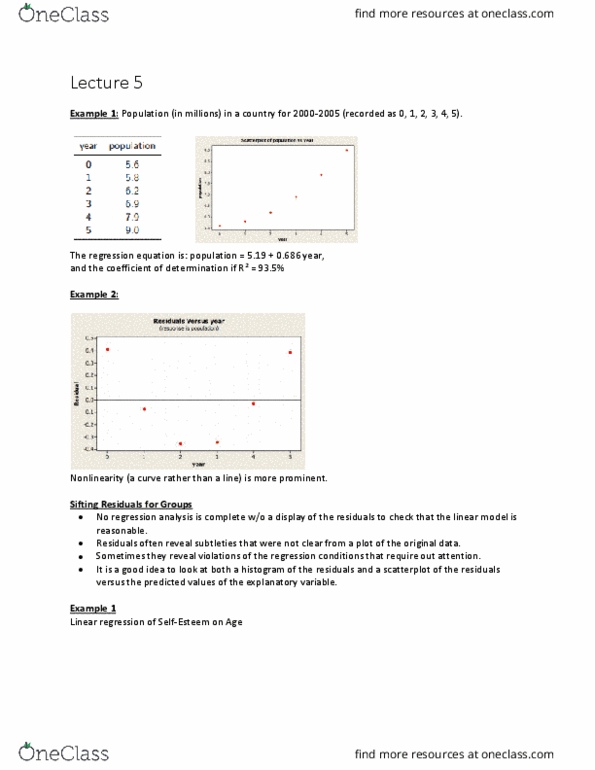
Example: population (in millions) in a country for 2000-2005 (recorded as 0, 1, 2, 3, 4, 5): year population. 1 n o i t a l u p o p. The regression equation is population = 5. 19 + 0. 686 year. Residuals versus year (response is population) l a u d i s e. No regression analysis is complete without a display of the residuals to check that the linear model is reasonable. Residuals often reveal subtleties that were not clear from a plot of the original data. Sometimes they reveal violations of the regression conditions that require our attention. it is a good idea to look at both a histogram of the residuals and a scatterplot of the residuals vs. predicted values: Residuals versus the fitted values (response is self-esteem) 5. 0 l a u d i s e. an examination of residuals often leads us to discover groups of observations that are different from the rest.