STAB22H3 Lecture Notes - Lecture 2: Minimax, Summary Statistics, Central Tendency


38
STAB22H3 Full Course Notes
Verified Note
38 documents
Document Summary
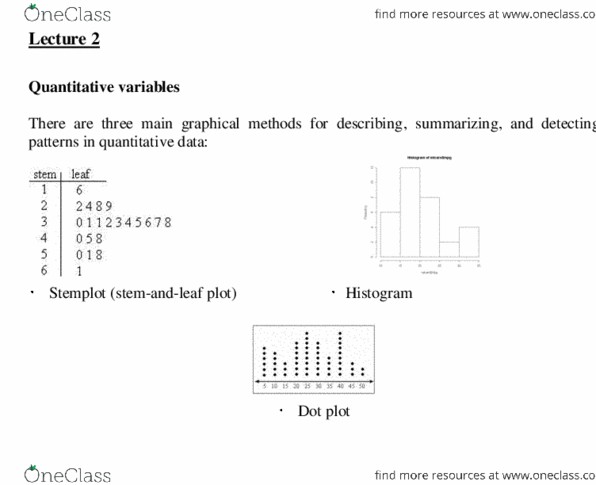
There are summarizing, and detecting patterns in quantitative data: three main graphical methods for describing, A stemplot gives a quick picture of the shape of a distribution while including the actual numerical values in the graph. Example: literacy of men and women: table below shows the percent of men and women at least 15 years old who were literate in 2002 in the major islamic nations: If you wish to compare two related distributions, a back-to-back stemplot with common stems is useful: It places a dot along an axis for each case in the data. It is very like a stemplot but with dots instead of digits for all the leaves. They are quite useful for small data sets. Here is a dotplot of ages for a group of people: A distribution with one major peak is called unimodal. Is it approximately symmetric or skewed in one direction. Example: describe the shapes of the distributions summarized by the following stemplots.