STAB22H3 Lecture Notes - Lecture 3: South Dakota Highway 10, Standard Deviation, Quartile


38
STAB22H3 Full Course Notes
Verified Note
38 documents
Document Summary
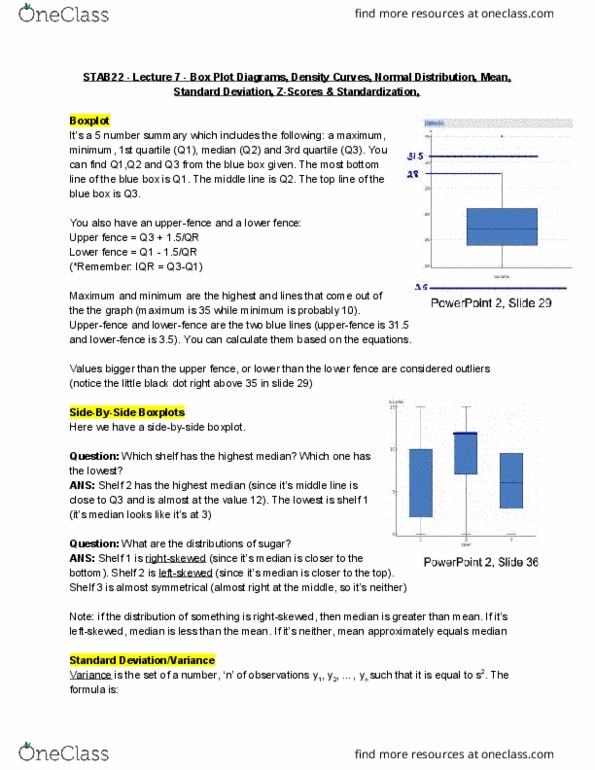
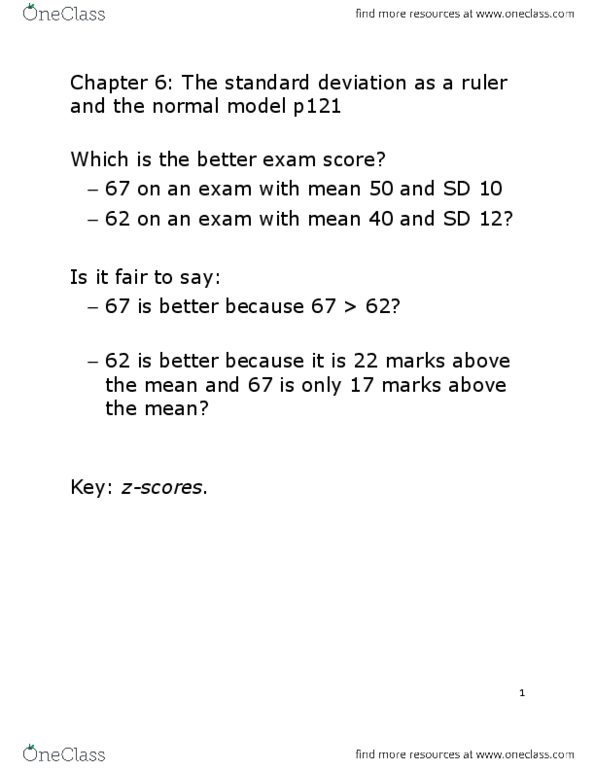
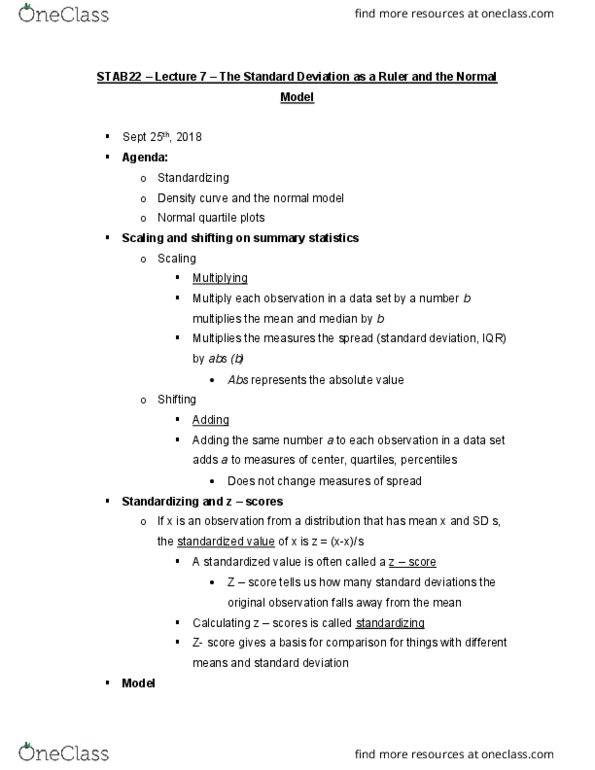
Effect of scaling and shifting on summary statistics. Scaling: multiplying each observation in a data set by a number b multiplies the mean, median, by and the measures of spread (standard deviation, iqr) by abs(b), where abs represents the absolute value. Mean --> 1. 5 x mean (same for medium) Iqr --> 1. 5 iqr = |1. 5| iqr (same for s. d. ) Shifting: adding the same number a to each observation in a data set adds a to measures of center, quartiles, percentiles but does not change measures of spread. Z = 67-50 = 1. 7 z = 62-40 = 1. 83. 62 becomes (62-40)/12=1. 83 so the 62 is a (slightly) better (better/worse) performance, relative to the mean and sd. Model: the z-score gave us an indication about how unusual a value is, to say more about how big we expect a data value to be, we need to model the distribution of the data.