PSYA01H3 Lecture Notes - Lecture 6: Jane Goodall, Microsoft Onenote, Standard Deviation

Document Summary
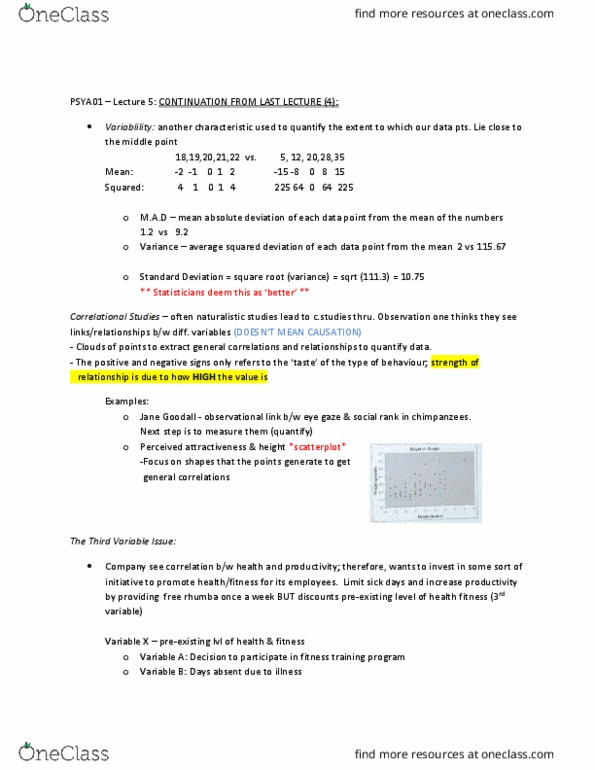
Some idea of the spread of the tendency. Another characteristic we often wish to quantify is the extent to which our data points lie close to the middle point. 2 -1 0 1 2 -15 -8 0 8 15. These represent how far the nr is from the mean. Remove the negatives to find how relatively far from the mean it is. : the mean absolute deviation of each data point from the mean of the numbers. 1. 2 vs. 9. 2, 1st set vs. 2nd set. Variance: the avg. squared deviation of each data point from the mean. Square the deviations (individual numbers), add them up, divide by the nr, you get the avg square deviation & get the variance. Scientists compute the variance, square root it, and call it standard deviation. Variance is better than m. a. d in terms of the mathematical properties. Def: involves measuring the degree of association between two or more variables.