PSYA01H3 Lecture Notes - Lecture 5: Average Absolute Deviation, Jane Goodall, Dependent And Independent Variables

Document Summary
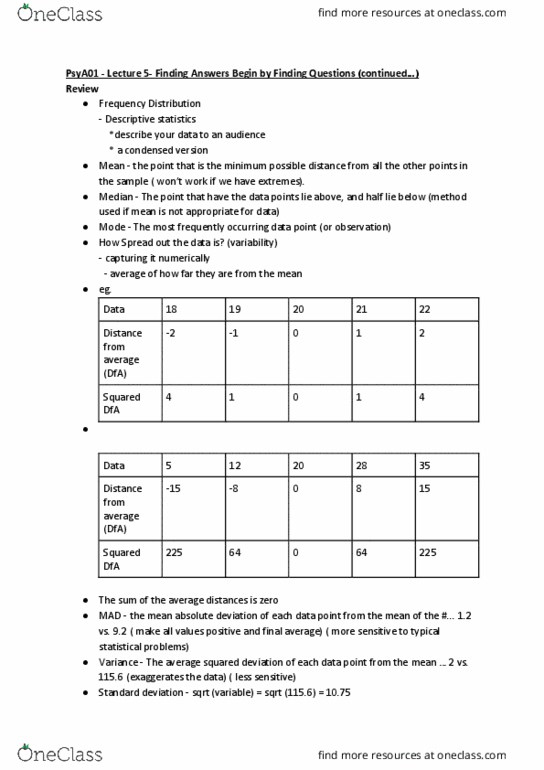
Chapter 2, lecture 2 continued (experimentation: finding the cause) Another characteristic we often wish to quantify is the extent to which our data points lie close to the middle point. Ex: 18, 19, 20, 21, 22 vs. 5, 12, 20, 28, 35. 2, -1, 0, 1, 2 -15, -8, 0, 8, 15. It is clear the second group has more deviance (greater points away from the mean) Above, the following equation was applied to obtain the values listed. ((sum of all the values squared)/# of value points)) This becomes an issue when you would like to calculate something because the normal mean deviation cancels out the other calculations. Variance the a(cid:448)e(cid:396)age s(cid:395)ua(cid:396)ed de(cid:448)iatio(cid:374) of ea(cid:272)h data poi(cid:374)t f(cid:396)o(cid:373) the (cid:373)ea(cid:374) 2 vs. 115. 6. The mean absolute deviation of each data point from the mean of the (cid:374)u(cid:373)(cid:271)e(cid:396)s (cid:1005). (cid:1006) (cid:448)s. Standard deviation sqrt(variance) = sqrt(115. 6) = ~10. 75. Quite often naturalistic studies lead to correlational studies.