LINB09H3 Lecture Notes - Lecture 8: Vocal Folds, Formant, Spectrogram

Document Summary
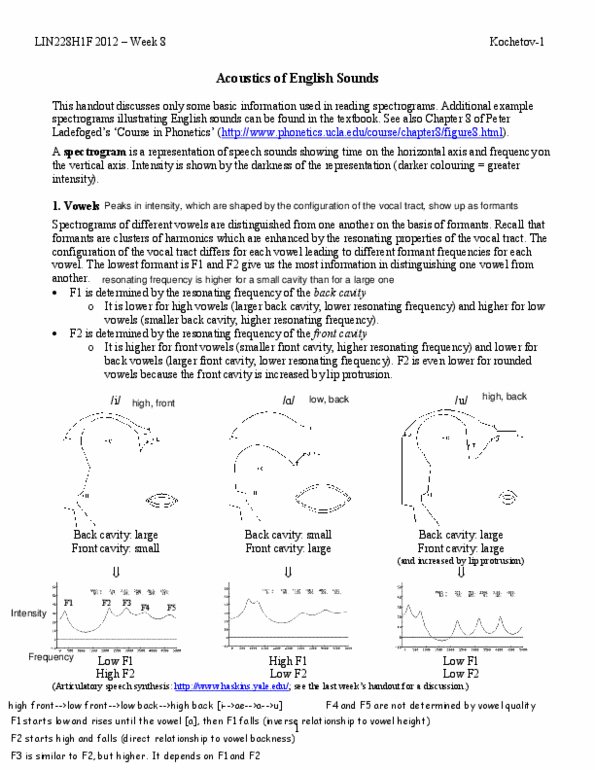
Spectrogram is created by displaying all the spectra computed from the speech waveform together. Spectrogram shows frequency n the vertical axis and time on the horizontal axis. Intensity is shown by the darkness of the representation. Periodic - repeating patterns (voiced sounds) change i vocal folds pressure. Analysis done for longer duration (3 months) of the signal. Doesn t capture rapid spectral change over time (bad time) Time dimension is quite precise but bad with spectral info. Analysis is done over relatively shorter section (5 min) Captures rapid spectral changes over time (good with time) Open - dark closed - lighter cycle of folds vibrations. Taking a sampling of the digital recording of specified intervals. Sampling rate is the number of measurements made per second. Higher sampling rate , more accurate the recording will be. Sine wave with frequency 100hz-> sampling rate at least 200hz.