MGAB02H3 Lecture Notes - Lecture 1: Current Liability, Finance Lease, Cash Flow
36 views6 pages

6 Jan 2016
School
Department
Course
Professor
Document Summary
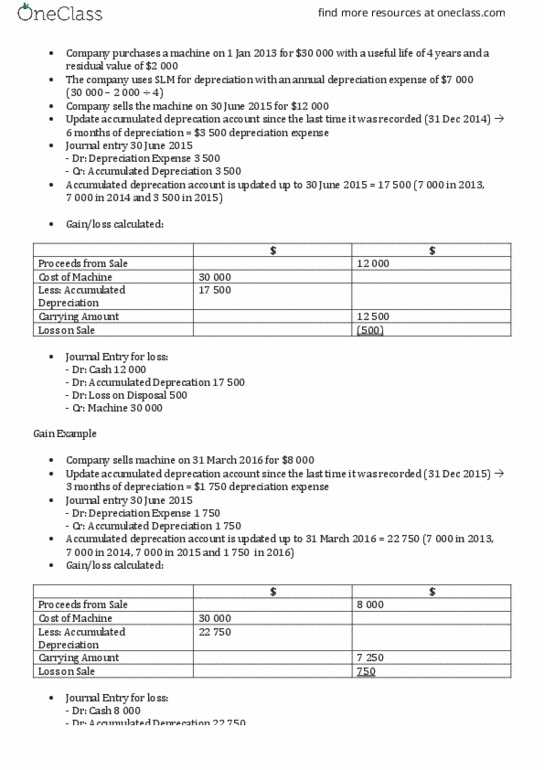
Carrying amount of the disposals and transfers (,436. 3 1,882. 8) Deduct: loss on disposal of property, plant and equipment (on statement of cash flows) Percentage depreciation expense to cash flow from operations. = (,588. 5 / ,918. 5) x 100 = 82. 8 % A relatively high percentage of the cash flow from operations resulted from adding back depreciation expense to net earnings in the reconciliation. This indicates the high level of capital assets needed for the airline"s operations. Machine a jan. 1, 2015: (a) depreciation expense in 2015 - none recorded because disposal date was jan. 1, 2015. Gain on disposal of machine (+r +se) (b) to record disposal: Machine b april 1, 2015: (a) to record depreciation expense for jan. through march, 2015: [(,000 ,000) 10 years] x 3/12 = . (b) to record disposal: Accumulated depreciation, machine b ( xa +a) (,600 + ) Loss on disposal of machine (+r +se) Machine c july 2, 2015: (a) depreciation expense for jan.
Get access
Grade+
$40 USD/m
Billed monthly

Homework Help
Study Guides
Textbook Solutions
Class Notes
Textbook Notes
Booster Class
10 Verified Answers
Class+
$30 USD/m
Billed monthly

Homework Help
Study Guides
Textbook Solutions
Class Notes
Textbook Notes
Booster Class
7 Verified Answers
Related Documents
Related Questions
What are the Balance Sheet Ratios (debt-to-asset and debt-to-equity ratios) for the following financial information? (PLEASE SHOW WORK SO I CAN UNDERSTAND HOW THIS WAS DONE. Thank you)
| GENERAL ELECTRIC CO (GE) CashFlowFlag BALANCE SHEET | ||
| Fiscal year ends in December. USD in millions except per share data. | 2014-12 | 2015-12 |
| Assets | ||
| Current assets | ||
| Cash | ||
| Cash and cash equivalents | 90208 | 70483 |
| Short-term investments | 47907 | 31973 |
| Total cash | 138115 | 102456 |
| Receivables | 23237 | 27022 |
| Inventories | 17689 | 22515 |
| Other current assets | 233911 | 18834 |
| Total current assets | 412952 | 170827 |
| Non-current assets | ||
| Property, plant and equipment | ||
| Gross property, plant and equipment | 113321 | 90961 |
| Accumulated Depreciation | -46934 | -35927 |
| Net property, plant and equipment | 66387 | 54095 |
| Equity and other investments | 33822 | 12673 |
| Goodwill | 76553 | 65526 |
| Intangible assets | 14156 | 16745 |
| Deferred income taxes | 2541 | 3105 |
| Other long-term assets | 41938 | 169721 |
| Total non-current assets | 235397 | 321865 |
| Total assets | 648349 | 492692 |
| Liabilities and stockholders' equity | ||
| Liabilities | ||
| Current liabilities | ||
| Short-term debt | 79231 | 50810 |
| Accounts payable | 16338 | 13680 |
| Accrued liabilities | 12537 | 15776 |
| Other current liabilities | 54990 | 25764 |
| Total current liabilities | 163096 | 106030 |
| Non-current liabilities | ||
| Long-term debt | 222910 | 147466 |
| Deferred taxes liabilities | ||
| Pensions and other benefits | 40487 | |
| Minority interest | 8674 | 1864 |
| Other long-term liabilities | 125510 | 98571 |
| Total non-current liabilities | 357094 | 288388 |
| Total liabilities | 520190 | 394418 |
| Stockholders' equity | ||
| Preferred stock | 6 | |
| Common stock | 702 | 702 |
| Additional paid-in capital | 32889 | 37613 |
| Retained earnings | 155333 | 140020 |
| Treasury stock | -42593 | -63539 |
| Accumulated other comprehensive income | -18172 | -16528 |
| Total stockholders' equity | 128159 | 98274 |
| Total liabilities and stockholders' equity | 648349 | 492692 |
| GENERAL ELECTRIC CO (GE) CashFlowFlag INCOME STATEMENT | ||
| Fiscal year ends in December. USD in millions except per share data. | 2014-12 | 2015-12 |
| Revenue | 148589 | 117386 |
| Cost of revenue | 81311 | 82693 |
| Gross profit | 67278 | 34693 |
| Operating expenses | ||
| Sales, General and administrative | 30572 | 17831 |
| Other operating expenses | 9995 | |
| Total operating expenses | 40567 | 17831 |
| Operating income | 26711 | 16862 |
| Interest Expense | 9482 | 3463 |
| Other income (expense) | -5213 | |
| Income before taxes | 17229 | 8186 |
| Provision for income taxes | 1772 | 6486 |
| Net income from continuing operations | 15457 | 1700 |
| Net income from discontinuing ops | -112 | -7495 |
| Other | -112 | -331 |
| Net income | 15233 | -6126 |
| Preferred dividend | 18 | |
| Net income available to common shareholders | 15233 | -6144 |
| Earnings per share | ||
| Basic | 1.51 | -0.62 |
| Diluted | 1.5 | -0.61 |
| Weighted average shares outstanding | ||
| Basic | 10045 | 9944 |
| Diluted | 10123 | 10016 |
| EBITDA | 35994 | 16496 |
| GENERAL ELECTRIC CO (GE) Statement of CASH FLOW | ||
| Fiscal year ends in December. USD in millions except per share data. | 2014-12 | 2015-12 |
| Cash Flows From Operating Activities | ||
| Net income | 15345 | -6126 |
| Depreciation & amortization | 9283 | 4847 |
| Deferred income taxes | -1186 | 383 |
| (Gain) Loss from discontinued operations | 112 | 7495 |
| Accounts receivable | ||
| Inventory | -872 | -314 |
| Accounts payable | 305 | -541 |
| Other working capital | -2428 | -1048 |
| Other non-cash items | 7151 | 15195 |
| Net cash provided by operating activities | 27710 | 19891 |
| Cash Flows From Investing Activities | ||
| Investments in property, plant, and equipment | -13727 | -7309 |
| Property, plant, and equipment reductions | 6262 | 3020 |
| Acquisitions, net | 311 | -9744 |
| Sales/Maturities of investments | ||
| Other investing activities | 2124 | 73521 |
| Net cash used for investing activities | -5030 | 59488 |
| Cash Flows From Financing Activities | ||
| Debt issued | 37548 | 13951 |
| Debt repayment | -47038 | |
| Preferred stock issued | ||
| Common stock issued | 2842 | |
| Dividend paid | -8851 | -9295 |
| Other financing activities | -48497 | -33672 |
| Net cash provided by (used for) financing activities | -16958 | -76054 |
| Effect of exchange rate changes | -3492 | -3464 |
| Net change in cash | 2230 | -139 |
| Cash at beginning of period | 88787 | 91017 |
| Cash at end of period | 91017 | 90878 |
| Free Cash Flow | ||
| Operating cash flow | 27710 | 19891 |
| Capital expenditure | -13727 | -7309 |
| Free cash flow | 13983 | 12582 |

What is the return on Invested Capital (ROIC) for the financial data? (PLEASE SHOW WORK SO I CAN UNDERSTAND HOW THIS WAS DONE. Thank you)
| GENERAL ELECTRIC CO (GE) CashFlowFlag BALANCE SHEET | ||
| Fiscal year ends in December. USD in millions except per share data. | 2014-12 | 2015-12 |
| Assets | ||
| Current assets | ||
| Cash | ||
| Cash and cash equivalents | 90208 | 70483 |
| Short-term investments | 47907 | 31973 |
| Total cash | 138115 | 102456 |
| Receivables | 23237 | 27022 |
| Inventories | 17689 | 22515 |
| Other current assets | 233911 | 18834 |
| Total current assets | 412952 | 170827 |
| Non-current assets | ||
| Property, plant and equipment | ||
| Gross property, plant and equipment | 113321 | 90961 |
| Accumulated Depreciation | -46934 | -35927 |
| Net property, plant and equipment | 66387 | 54095 |
| Equity and other investments | 33822 | 12673 |
| Goodwill | 76553 | 65526 |
| Intangible assets | 14156 | 16745 |
| Deferred income taxes | 2541 | 3105 |
| Other long-term assets | 41938 | 169721 |
| Total non-current assets | 235397 | 321865 |
| Total assets | 648349 | 492692 |
| Liabilities and stockholders' equity | ||
| Liabilities | ||
| Current liabilities | ||
| Short-term debt | 79231 | 50810 |
| Accounts payable | 16338 | 13680 |
| Accrued liabilities | 12537 | 15776 |
| Other current liabilities | 54990 | 25764 |
| Total current liabilities | 163096 | 106030 |
| Non-current liabilities | ||
| Long-term debt | 222910 | 147466 |
| Deferred taxes liabilities | ||
| Pensions and other benefits | 40487 | |
| Minority interest | 8674 | 1864 |
| Other long-term liabilities | 125510 | 98571 |
| Total non-current liabilities | 357094 | 288388 |
| Total liabilities | 520190 | 394418 |
| Stockholders' equity | ||
| Preferred stock | 6 | |
| Common stock | 702 | 702 |
| Additional paid-in capital | 32889 | 37613 |
| Retained earnings | 155333 | 140020 |
| Treasury stock | -42593 | -63539 |
| Accumulated other comprehensive income | -18172 | -16528 |
| Total stockholders' equity | 128159 | 98274 |
| Total liabilities and stockholders' equity | 648349 | 492692 |
| GENERAL ELECTRIC CO (GE) CashFlowFlag INCOME STATEMENT | ||
| Fiscal year ends in December. USD in millions except per share data. | 2014-12 | 2015-12 |
| Revenue | 148589 | 117386 |
| Cost of revenue | 81311 | 82693 |
| Gross profit | 67278 | 34693 |
| Operating expenses | ||
| Sales, General and administrative | 30572 | 17831 |
| Other operating expenses | 9995 | |
| Total operating expenses | 40567 | 17831 |
| Operating income | 26711 | 16862 |
| Interest Expense | 9482 | 3463 |
| Other income (expense) | -5213 | |
| Income before taxes | 17229 | 8186 |
| Provision for income taxes | 1772 | 6486 |
| Net income from continuing operations | 15457 | 1700 |
| Net income from discontinuing ops | -112 | -7495 |
| Other | -112 | -331 |
| Net income | 15233 | -6126 |
| Preferred dividend | 18 | |
| Net income available to common shareholders | 15233 | -6144 |
| Earnings per share | ||
| Basic | 1.51 | -0.62 |
| Diluted | 1.5 | -0.61 |
| Weighted average shares outstanding | ||
| Basic | 10045 | 9944 |
| Diluted | 10123 | 10016 |
| EBITDA | 35994 | 16496 |
| GENERAL ELECTRIC CO (GE) Statement of CASH FLOW | ||
| Fiscal year ends in December. USD in millions except per share data. | 2014-12 | 2015-12 |
| Cash Flows From Operating Activities | ||
| Net income | 15345 | -6126 |
| Depreciation & amortization | 9283 | 4847 |
| Deferred income taxes | -1186 | 383 |
| (Gain) Loss from discontinued operations | 112 | 7495 |
| Accounts receivable | ||
| Inventory | -872 | -314 |
| Accounts payable | 305 | -541 |
| Other working capital | -2428 | -1048 |
| Other non-cash items | 7151 | 15195 |
| Net cash provided by operating activities | 27710 | 19891 |
| Cash Flows From Investing Activities | ||
| Investments in property, plant, and equipment | -13727 | -7309 |
| Property, plant, and equipment reductions | 6262 | 3020 |
| Acquisitions, net | 311 | -9744 |
| Sales/Maturities of investments | ||
| Other investing activities | 2124 | 73521 |
| Net cash used for investing activities | -5030 | 59488 |
| Cash Flows From Financing Activities | ||
| Debt issued | 37548 | 13951 |
| Debt repayment | -47038 | |
| Preferred stock issued | ||
| Common stock issued | 2842 | |
| Dividend paid | -8851 | -9295 |
| Other financing activities | -48497 | -33672 |
| Net cash provided by (used for) financing activities | -16958 | -76054 |
| Effect of exchange rate changes | -3492 | -3464 |
| Net change in cash | 2230 | -139 |
| Cash at beginning of period | 88787 | 91017 |
| Cash at end of period | 91017 | 90878 |
| Free Cash Flow | ||
| Operating cash flow | 27710 | 19891 |
| Capital expenditure | -13727 | -7309 |
| Free cash flow | 13983 | 12582 |

What are the Balance Sheet Ratios (debt-to-asset and debt-to-equity ratios) for the following financial information for 2015 and 2016? (PLEASE SHOW WORK SO I CAN UNDERSTAND HOW THIS WAS DONE. Thank you)
| AMAZON.COM INC (AMZN) CashFlowFlag INCOME STATEMENT | ||
| Fiscal year ends in December. USD in millions except per share data. | 2015-12 | 2016-12 |
| Revenue | 107006 | 135987 |
| Cost of revenue | 71651 | 88265 |
| Gross profit | 35355 | 47722 |
| Operating expenses | ||
| Sales, General and administrative | 20411 | 27284 |
| Other operating expenses | 12711 | 16252 |
| Total operating expenses | 33122 | 43536 |
| Operating income | 2233 | 4186 |
| Interest Expense | 459 | 484 |
| Other income (expense) | -206 | 190 |
| Income before income taxes | 1568 | 3892 |
| Provision for income taxes | 950 | 1425 |
| Other income | -22 | -96 |
| Net income from continuing operations | 596 | 2371 |
| Net income | 596 | 2371 |
| Net income available to common shareholders | 596 | 2371 |
| Earnings per share | ||
| Basic | 1.28 | 5.01 |
| Diluted | 1.25 | 4.9 |
| Weighted average shares outstanding | ||
| Basic | 467 | 474 |
| Diluted | 477 | 484 |
| EBITDA | 8308 | 12492 |
| AMAZON.COM INC (AMZN) CashFlowFlag BALANCE SHEET | ||
| Fiscal year ends in December. USD in millions except per share data. | 2015-12 | 2016-12 |
| Assets | ||
| Current assets | ||
| Cash | ||
| Cash and cash equivalents | 15890 | 19334 |
| Short-term investments | 3918 | 6647 |
| Total cash | 19808 | 25981 |
| Receivables | 6423 | 8339 |
| Inventories | 10243 | 11461 |
| Deferred income taxes | ||
| Total current assets | 36474 | 45781 |
| Non-current assets | ||
| Property, plant and equipment | ||
| Land | 9770 | 13998 |
| Fixtures and equipment | 18417 | 25989 |
| Other properties | 1866 | 2454 |
| Property and equipment, at cost | 30053 | 42441 |
| Accumulated Depreciation | -8215 | -13327 |
| Property, plant and equipment, net | 21838 | 29114 |
| Goodwill | 3759 | 3784 |
| Intangible assets | ||
| Deferred income taxes | 1084 | |
| Other long-term assets | 2289 | 4723 |
| Total non-current assets | 28970 | 37621 |
| Total assets | 65444 | 83402 |
| Liabilities and stockholders' equity | ||
| Liabilities | ||
| Current liabilities | ||
| Accounts payable | 20397 | 25309 |
| Accrued liabilities | 10384 | 13739 |
| Deferred revenues | 3118 | 4768 |
| Total current liabilities | 33899 | 43816 |
| Non-current liabilities | ||
| Long-term debt | 8235 | 7694 |
| Capital leases | 5948 | 7519 |
| Deferred taxes liabilities | 392 | |
| Other long-term liabilities | 3978 | 4696 |
| Total non-current liabilities | 18161 | 20301 |
| Total liabilities | 52060 | 64117 |
| Stockholders' equity | ||
| Common stock | 5 | 5 |
| Additional paid-in capital | 13394 | 17186 |
| Retained earnings | 2545 | 4916 |
| Treasury stock | -1837 | -1837 |
| Accumulated other comprehensive income | -723 | -985 |
| Total stockholders' equity | 13384 | 19285 |
| Total liabilities and stockholders' equity | 65444 | 83402 |
| AMAZON.COM INC (AMZN) Statement of CASH FLOW | ||
| Fiscal year ends in December. USD in millions except per share data. | 2015-12 | 2016-12 |
| Cash Flows From Operating Activities | ||
| Net income | 596 | 2371 |
| Depreciation & amortization | 6281 | 8116 |
| Investments losses (gains) | 5 | |
| Deferred income taxes | 81 | -246 |
| Stock based compensation | 2119 | 2975 |
| Accounts receivable | -1755 | -3367 |
| Inventory | -2187 | -1426 |
| Accounts payable | 4294 | 5030 |
| Accrued liabilities | 913 | 1724 |
| Other working capital | 1292 | 1955 |
| Other non-cash items | 281 | -689 |
| Net cash provided by operating activities | 11920 | 16443 |
| Cash Flows From Investing Activities | ||
| Investments in property, plant, and equipment | -4589 | -6737 |
| Acquisitions, net | -795 | -116 |
| Purchases of investments | -4091 | -7756 |
| Sales/Maturities of investments | 3025 | 4733 |
| Net cash used for investing activities | -6450 | -9876 |
| Cash Flows From Financing Activities | ||
| Long-term debt issued | 353 | 621 |
| Long-term debt repayment | -4235 | -4361 |
| Excess tax benefit from stock based compensation | 119 | 829 |
| Repurchases of treasury stock | ||
| Net cash provided by (used for) financing activities | -3763 | -2911 |
| Effect of exchange rate changes | -374 | -212 |
| Net change in cash | 1333 | 3444 |
| Cash at beginning of period | 14557 | 15890 |
| Cash at end of period | 15890 | 19334 |
| Free Cash Flow | ||
| Operating cash flow | 11920 | 16443 |
| Capital expenditure | -4589 | -6737 |
| Free cash flow | 7331 | 9706 |
| Supplemental schedule of cash flow data | ||
| Cash paid for income taxes | 273 | 412 |
| Cash paid for interest | 478 | 496 |
