BIOC14H3 Lecture Notes - Lecture 4: Phenylketonuria, Connectome, Krabbe Disease

26 May 2018
School
Department
Course
Professor

1
Lecture 4
find more resources at oneclass.com
find more resources at oneclass.com

2
Lecture 4 Objectives
•Quantitative trait locus (QTL)
•QTL contribution to quantitative traits
•Studying QTLs
•QTL mapping in lab animals
•Distribution of quantitative traits
•Gene-environment interaction
•Evolution of traits
•Natural & Sexual selection
•Inclusive fitness
•Genetic diversity
•Environmental effects on genetics and behavior
•Prenatal environmental effects
•FAS
•CAH
•AIS
Chapter 6
Chapter 7
find more resources at oneclass.com
find more resources at oneclass.com
Inheritance of genetic traits
3
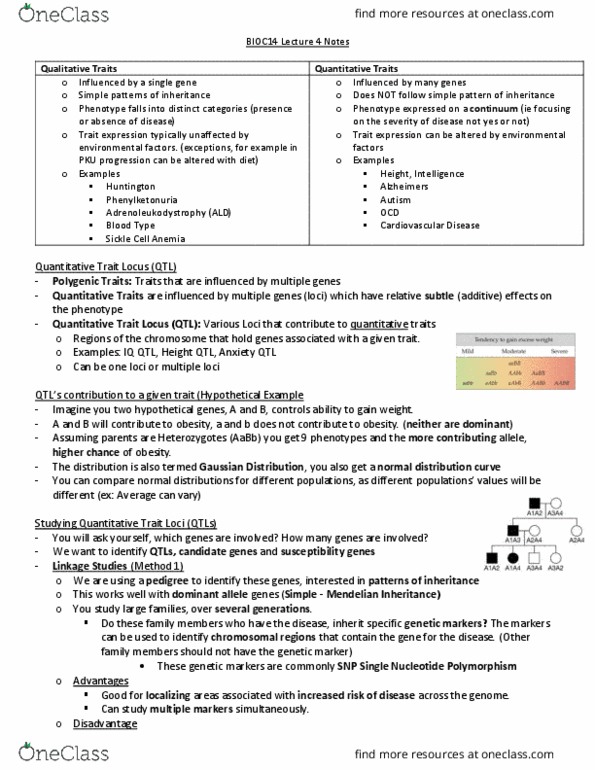
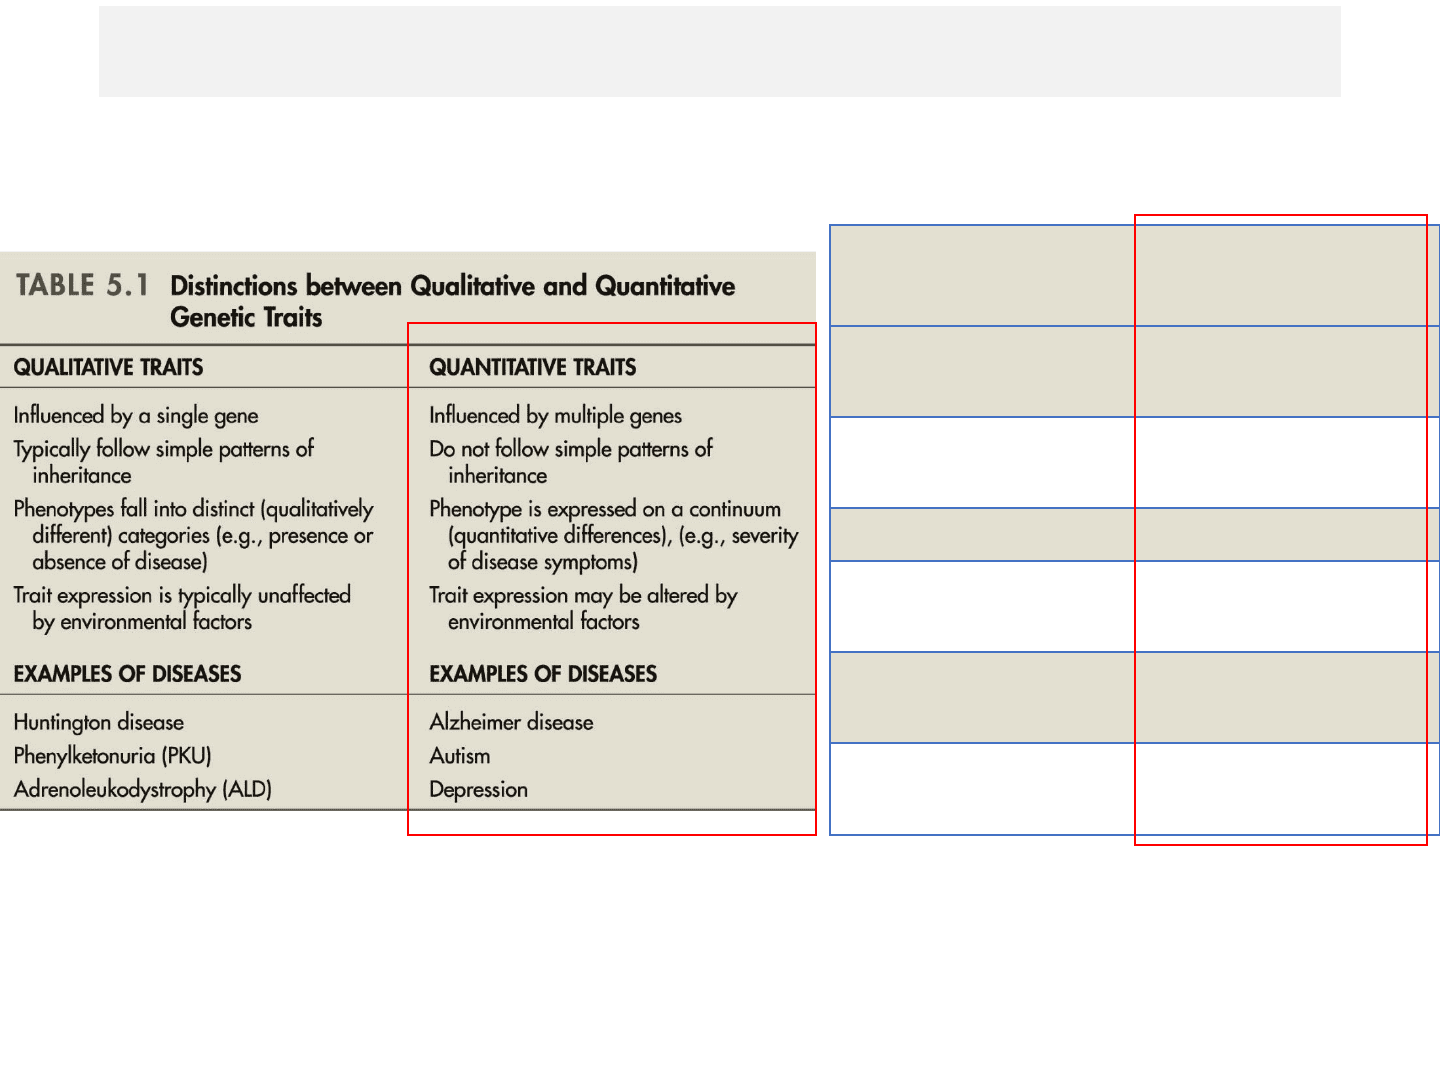
Qualitative traits Quantitative
traits
Blood types (A, B, AB,
O)
Height,
intelligence,
personality
Phenylketonuria
(PKU) Alzheimer's disease
Huntington disease Autism
Adrenoleukodystrophy
(ALD) Depression
Krabbe disease Obsessive-
compulsive disorder
Sickle cell anemia Cardiovascular
diseases
find more resources at oneclass.com
find more resources at oneclass.com
Document Summary
Lecture 4 objectives: quantitative trait locus (qtl, qtl contribution to quantitative traits, studying qtls, qtl mapping in lab animals, distribution of quantitative traits, gene-environment interaction, evolution of traits, natural & sexual selection. Inclusive fitness: genetic diversity, environmental effects on genetics and behavior, prenatal environmental effects, fas, cah, ais. More contributing genes = higher probability of developing obesity. Infinite number of loci model: arranging the genotype in order of contributing gene number (cid:198) normal distribution curve (bell curve, highest frequency in the middle, lowest frequency on each end. Distribution of birth weight: normal distribution is very common in nature. Linkage vs association studies: both types of analysis have their advantages and disadvantages. See: disease susceptibility advantage and disadvantages of linkage studies. See: disease susceptibility advantage and disadvantages of gene association studies. Identify loci that show high probability of being associated with the trait (p-value) Cross the two parental strains (cid:198) f1 (first filial generation) individuals.