SOC222H5 Lecture Notes - Lecture 3: Interval Ratio, Frequency Distribution, Histogram

Document Summary
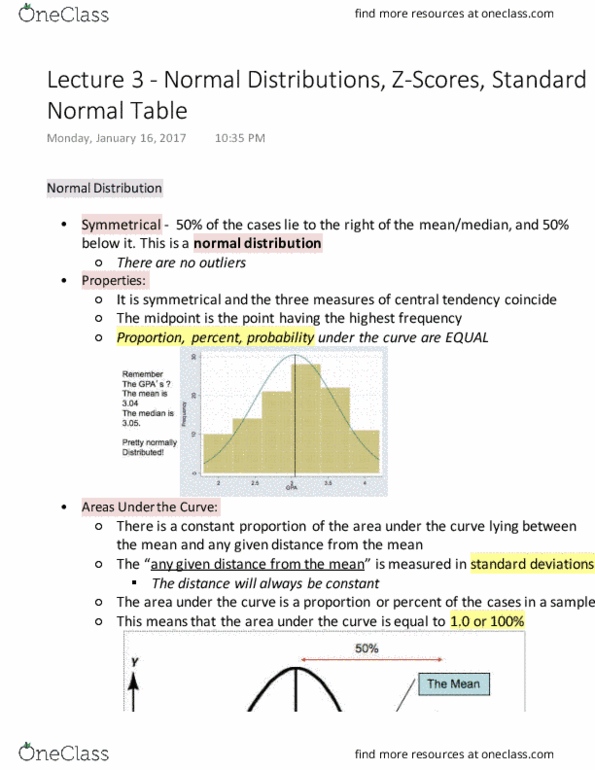
Normal distribution:it has dual components: fits into analysis and application. We can help predict how percentage of people have a certain range of scores. A guide for understanding what proportion of cases are likely to fall within a certain distance from the mean value in a sample. Histogram: shows frequency distribution of an interval ratio : a variable that has actual numbers to it height of bars shows the frequency of that category. Types of frequency distributions: examples of 3 extremes: If tale points to the left it is negatively skewed, if tale points to the right it is positively skewed. Symmetrical: when the mean, median & mode are all the same. Postively skewed: when the mean is greater than the median, the median is greater than the mode. When you data is not symmetrical your mean and median will be very different.