ENV100Y5 Lecture 29: L29 Ch14 - Global Climate Change Pt2


69
ENV100Y5 Full Course Notes
Verified Note
69 documents
Document Summary
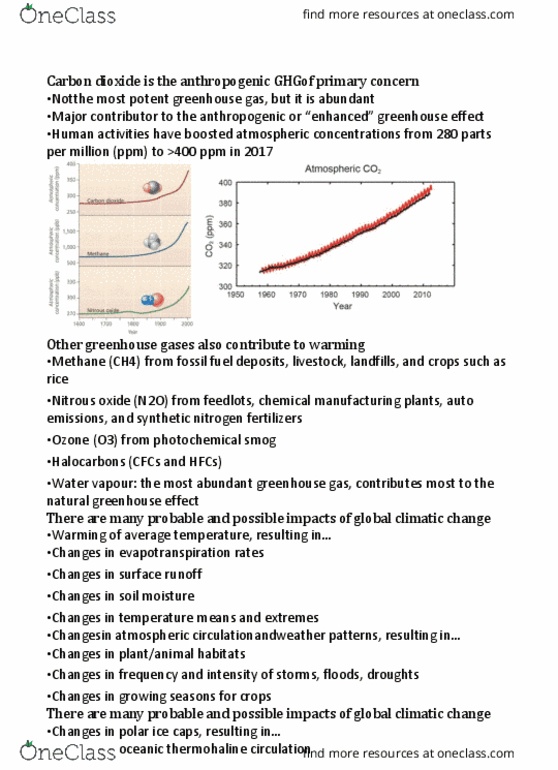
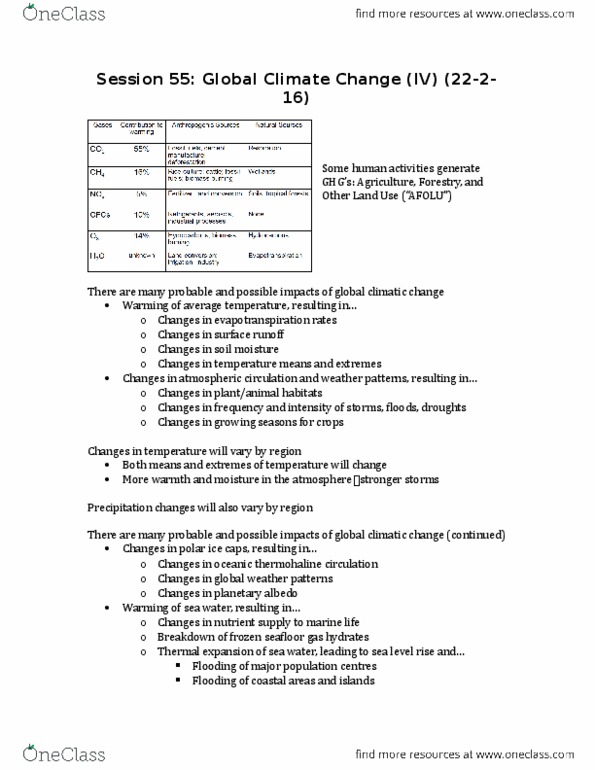
Co2 equivalent taken ghg emissions and seen as if co2 was causing all. Gt = giga tons / mt = mega tons. Keeling curve measuring trend toward increasing co2 emissions in the atmosphere: clear that something unusual is happening when you look at the graph. Many probable and possible impacts of global climatic change. War(cid:373)i(cid:374)g of a(cid:448)erage te(cid:373)perature, resulti(cid:374)g i(cid:374) : changes in evapotranspiration rates when it warms, evaporation occurs. Causes change in hydro cycle: changes in surface runoff, changes in soil moisture, changes in temperature means and extremes. Not every place will get uniformly warmer will depend regionally and will impact extremes. Some places will have more heat and some places will get colder. Changes in atmospheric circulation and weather patter(cid:374)s, resulti(cid:374)g i(cid:374) : changes in plant/animal habitats, changes in frequency and intensity of storms, floods, droughts. Hydrologic cycle storms come from warmth and moisture in the atmosphere.