PHY 1321 Lecture Notes - Lecture 1: Data Analysis, Cadastre, Approximation Error

3 Oct 2015
School
Department
Course
Professor


7
PHY 1321 Full Course Notes
Verified Note
7 documents
Document Summary
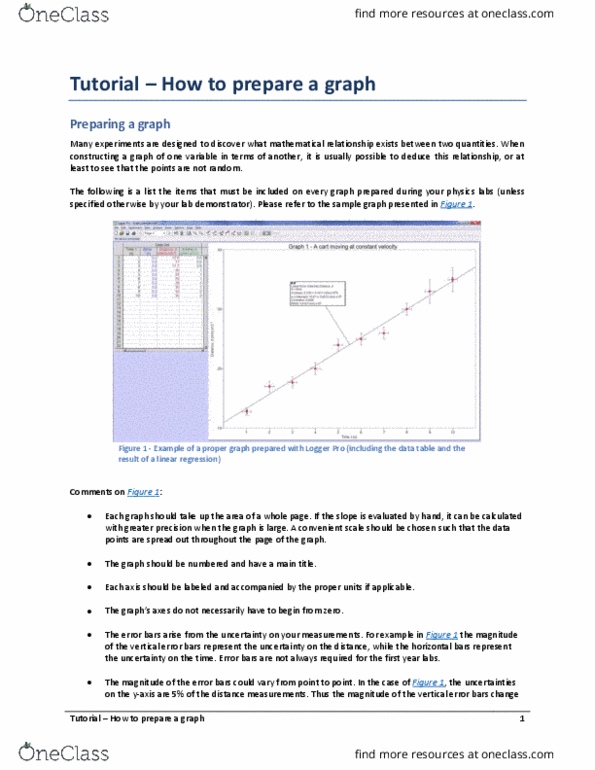
Many experiments are designed to discover what mathematical relationship exists between two quantities. When constructing a graph of one variable in terms of another, it is usually possible to deduce this relationship, or at least to see that the points are not random. The following is a list the items that must be included on every graph prepared during your physics labs (unless specified otherwise by your lab demonstrator). Please refer to the sample graph presented in figure 1. Figure 1 - example of a proper graph prepared with logger pro (including the data table and the result of a linear regression) Each graph should take up the area of a whole page. If the slope is evaluated by hand, it can be calculated with greater precision when the graph is large. A convenient scale should be chosen such that the data points are spread out throughout the page of the graph.