MAT 2379 Lecture Notes - Lecture 1: Biostatistics, Fetus, Scatter Plot

15 Dec 2015
School
Department
Course
Professor
Document Summary
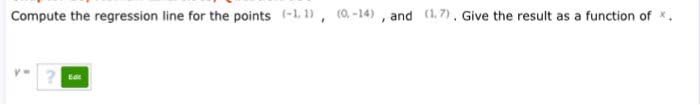
Introduction: we want to study the association between two numerical vari- ables. Simple regression is the study of the association between a dependent variable (also called the response) y and an independent variable (also called the predictor) We will assume that there is a statistical linear association between the response and the predictor. In other words as we produce a scatter plot of y against x, there should be a linear tendency. We want to nd a line to describe the response variable y as a linear function of the explanatory variable x and also de ne a measure to describe the t. Line of best t: to be able to nd a line of best t, we need a criterion of. That is, we need to know what we mean by best t. There are many ways to de ne what is best. Here we present one criterion, which is know as the least-squares criterion.