HSS 2381 Lecture 4: HSS2381 - Bivariate Data

7 Oct 2016
School
Department
Course
Professor
Document Summary
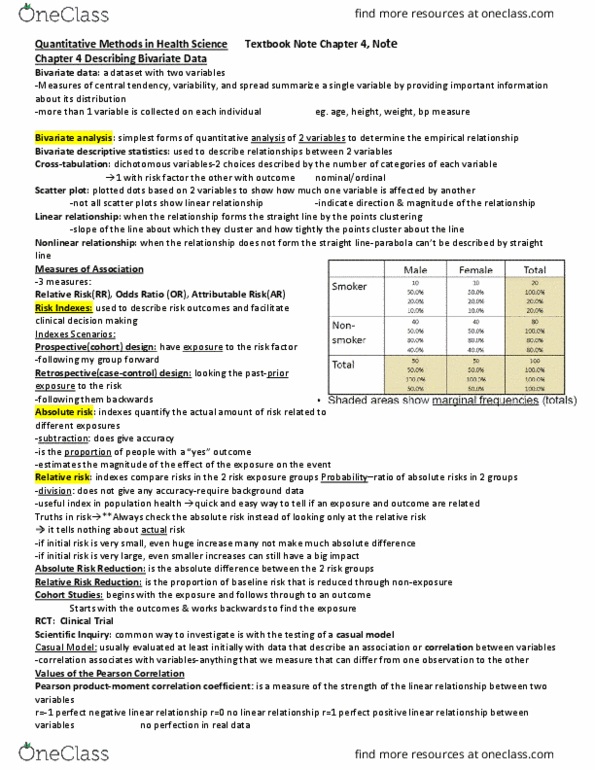
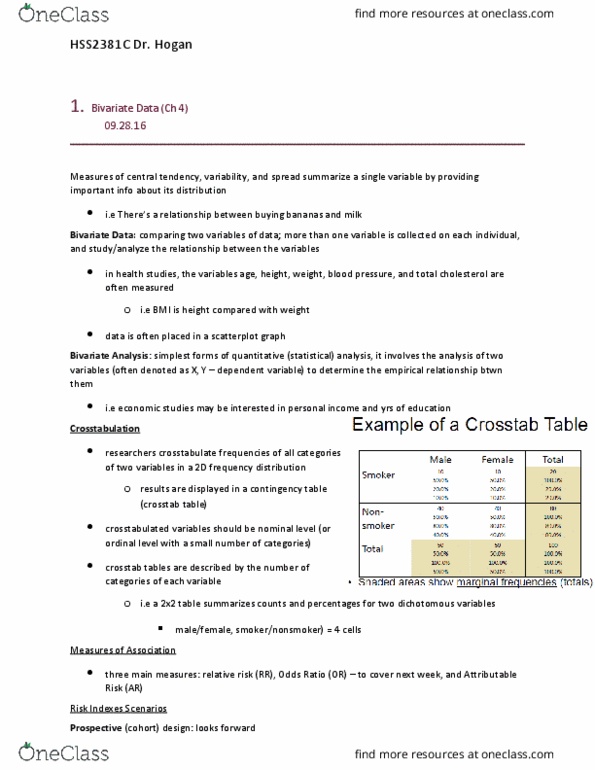
Measures of central tendency, variability, and spread summarize a single variable by providing important information about its distribution. More than one variable is collected on each individual. In health studies, the variables age, height, weight, blood pressure, and total cholesterol are often measured. Bivariate analysis: one of the simplest forms of quantitative (statistical) analysis. It involves the analysis of two variables (often denoted as x, y) for the purpose of determining the empirical relationship between them (there is uni-variable and multivariable as well) Bivariate descriptive statistics: used to describe relationships between two variables. Examples: height and weight, smoking status and lung cancer incidence. Appropriate statistic depends on the variables level of measurement. Bivariate data consists of data on two variables. Usually we are interested in the relationship between the variables. Researchers crosstabulate the frequencies of all categories of two variables in a two- dimensional frequency distribution: results are displayed in a contingency table (crosstab table)