CMN 3102 Lecture Notes - Lecture 3: Frequency Distribution, Construct Validity

30 Jan 2018
School
Department
Course
Professor


7
CMN 3102 Full Course Notes
Verified Note
7 documents
Document Summary
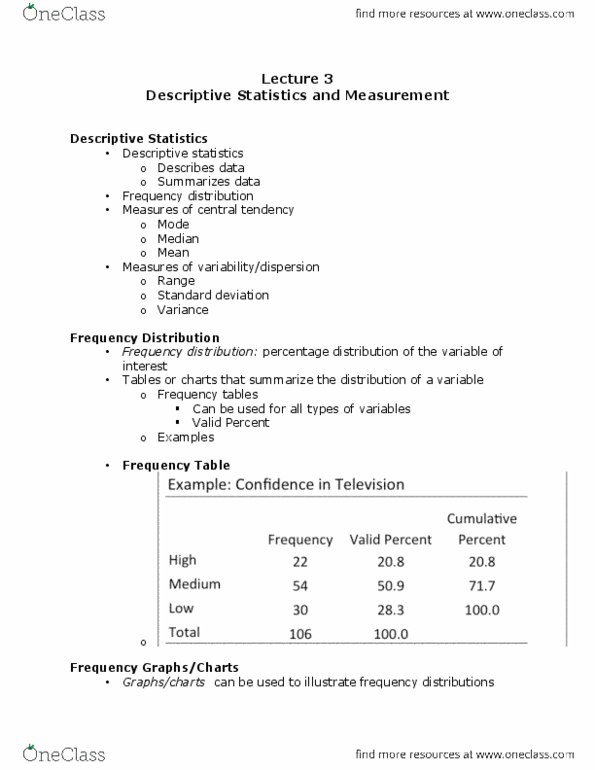
Measurement validity (or construct validity): involves the question, are you measuring what you want to measure?". Is achieved if the same or similar results are found each time a particular measurement technique is used on the same subject. Refers to the accuracy that a measure has in producing stable, consistent measurement. Percentage distribution of the variable of interest. Tables or summarize the distribution of a variable: frequency tables. Can be used for all types of variables. Can be used to illustrate frequency distributions. Bar charts: most appropriate for nominal and ordinal variables. Pie charts: most appropriate for nominal and ordinal variables with small number of values (categories) Histograms: most appropriate for interval-ratio variables with large number of values. Mode: most common value, all types of values, can be identified by the largest valid percent value in frequency distribution table.