STAT 251 Lecture Notes - Lecture 9: Standard Score, Takers, Standard Deviation


Chapter 5 - Normal Distribution
Outline
Normal Distribution
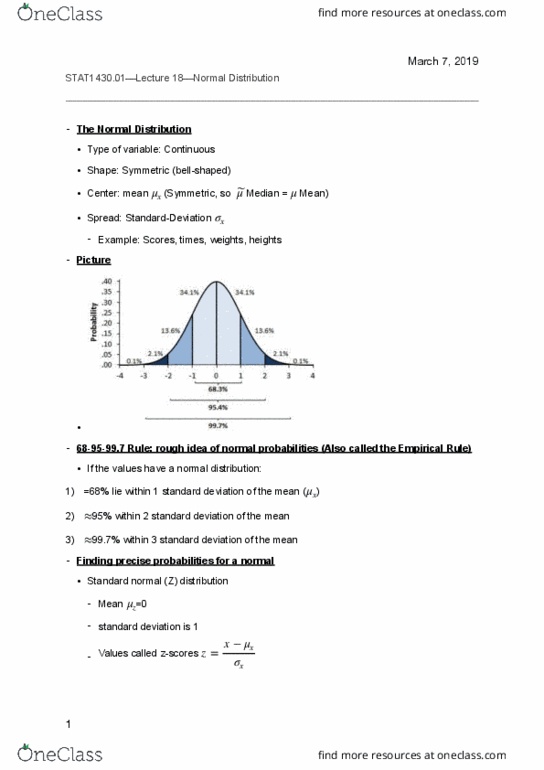
The 68-95-99.7 rule (Empirical rule)
Z- Score
The Standard Normal Distribution
Finding Normal proportions
Using the standard Normal table
Finding a value given a proportion
Important facts about the Normal Distribution
find more resources at oneclass.com
find more resources at oneclass.com

Normal Distributions
The Normal distribution is the most important distribution
in Statistics.
All Normal curves are symmetric, single-peaked, and bell-
shaped
Any specific Normal curve is described by giving its mean
µ (mu) and standard deviation σ (sigma) where µ and σ
are “parameters” which control the central location and
the dispersion
find more resources at oneclass.com
find more resources at oneclass.com

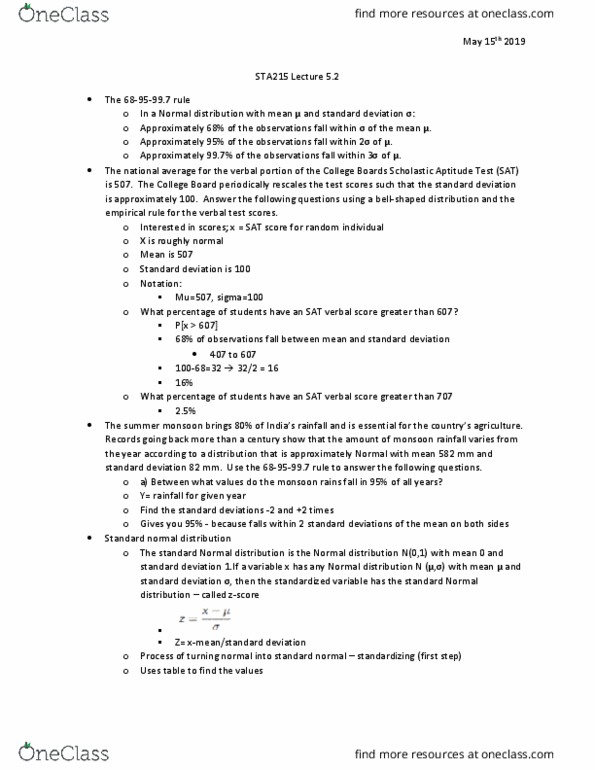
Normal Distributions
Any particular Normal distribution is completely
specified by two numbers: its mean µ and
standard deviation σ
The mean is located at the center of the symmetric
curve and is the same as the median. Changing µ
without changing σ moves the Normal curve along the
horizontal axis without changing its variability.
-10 0 25
find more resources at oneclass.com
find more resources at oneclass.com
Document Summary
The normal distribution is the most important distribution in statistics. All normal curves are symmetric, single-peaked, and bell- shaped. Any specific normal curve is described by giving its mean. (mu) and standard deviation (sigma) where and are parameters which control the central location and the dispersion. Any particular normal distribution is completely specified by two numbers: its mean and standard deviation . The mean is located at the center of the symmetric curve and is the same as the median. Changing without changing moves the normal curve along the horizontal axis without changing its variability. The standard deviation controls the variability of a normal curve. When the standard deviation is larger, the area under the normal curve is less concentrated about the mean. s = 15 s = 25. The normal distribution: as a mathematical function (pdf) x. In the normal distribution with mean and standard deviation : Approximately 68% of the observations fall within of .