SOCI 217 Lecture Notes - Lecture 20: Confidence Interval, Regression Analysis, Statistical Parameter


Week 11- social statistics
What is sampling error (standard error)
• Any measurement the measurement of a sample rather than the entire population will
contain a degree of sampling error
• Difference between a population value and an estimate of that value derived from a
sample
• s= PxQ/n
o P and Q in the formula equal the population parameters for the binomial
• 66% people feel universities are impersonal. Take a sample of 200 people.
o s= 0.66x0.34/200 = 0.0345
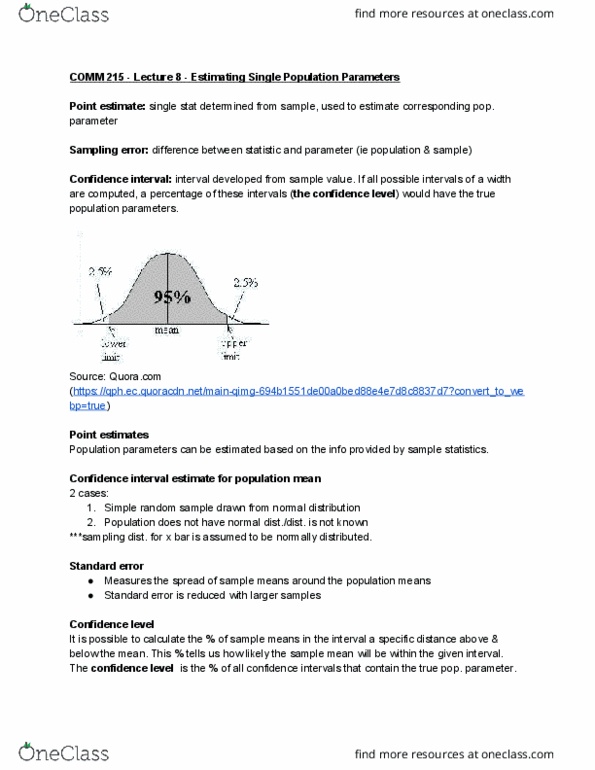
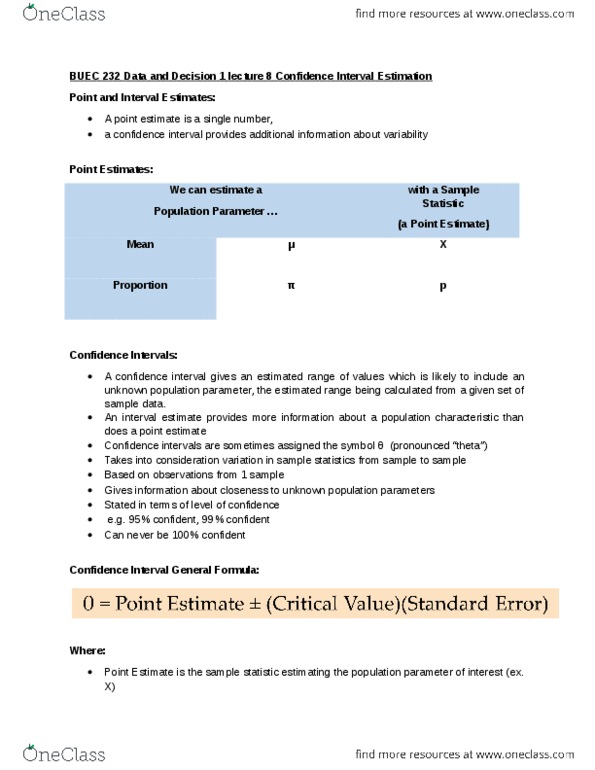
confidence interval and confidence level
• confidence interval
o specifies the range of values within which population parameter is estimated to
lie
• confidence level
o specifies the estimated probability that a population parameter lies within a
given confidence interval
• 40% believe that the president is doing a good job with standard error of 3%
o confidence intervals
▪ 68% confident that +/- 3 = 37 to 43
▪ 95% confident that +/- 6 = 34 to 46
▪ 99% confident that +/- 9 = 31 to 49
test of statistical significance
• no scientific answer to whether given association between two variables is significant,
strong, important, interesting, or worth reporting
• significant at the 0.05 level (p<0.05)
descriptive statistics
• statistical computations describing either the characteristics of a sample or the
relationship within the sample
• summarizes observations
• measures of association
o look at bivariate table
o just an impression
o proportionate reduction of error (PRE)
▪ how strong the relationship is
find more resources at oneclass.com
find more resources at oneclass.com