BIOL364 Lecture Notes - Lecture 2: Partial Fraction Decomposition, Raymond Pearl, Logistic Function

6 Jun 2015
School
Department
Course
Professor
Document Summary
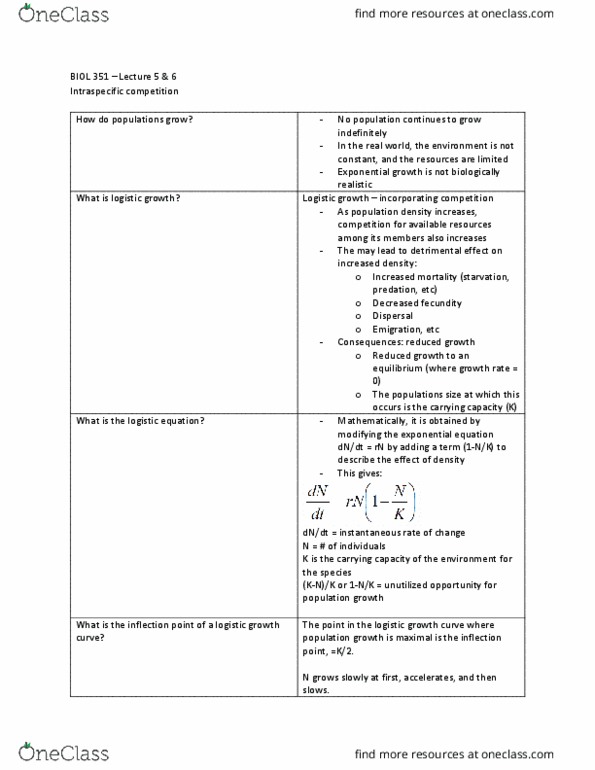
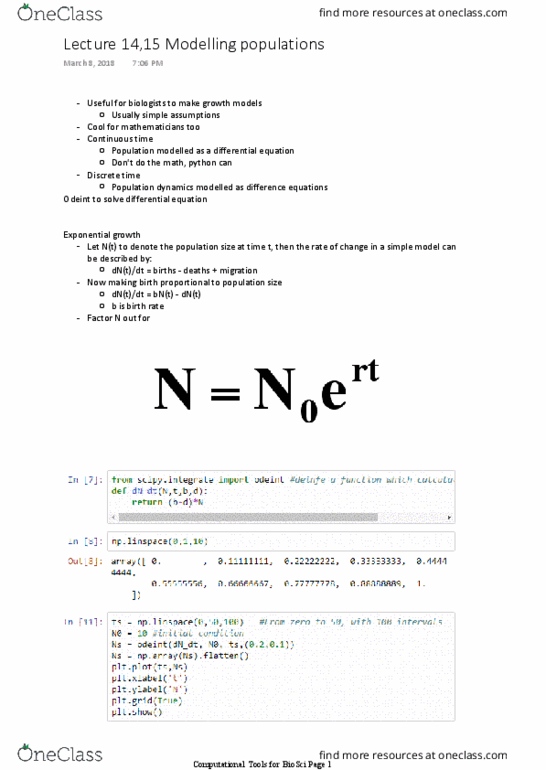
In this week"s lab you will formulate a model, and begin the process of analysis: formulating the logistic equation. Instead the density will increase until it reaches a maximum sustainable density that is set by the availability of resources. This upper limit to population growth, called the carrying capacity (k), was first described in 1845 by the belgian mathematician. Pierre-francoise verhulst and again in 1920 by the american demographers raymond pearl and. Population growth with a carrying capacity is called logistic population growth (logistic means to calculate, or to predict from an equation). It can be modeled in either continuous or discrete time. Let"s create a graph that contrasts these two model formulations. We"ll graph the per capita growth rate for exponential and logistic population growth. There are 3 ways to graph a function in matlab: we can use the plot, fplot or ezplot function.