GEOG 130 Lecture Notes - Lecture 8: Dependency Ratio, Population Pyramid


Age and Sex Structure:
Fertility and mortality vary significantly with age
o
Growth of a population is affected by age composition of population
o
Composition of a Population:
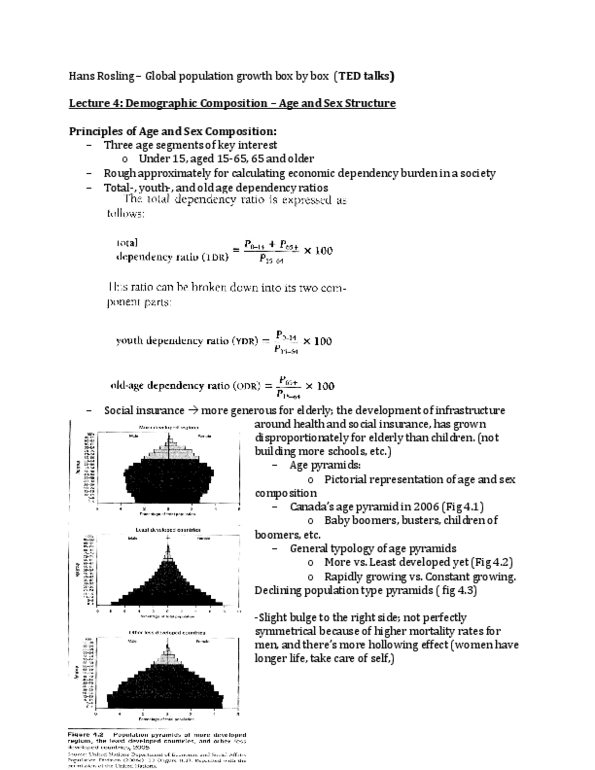
Population pyramids/ chart the show the percent of each group on the total
population, divided by gender – for poorer countries, the chart is shaped like a
pyramid. Infant mortality rates are high; life expectancy is shorter
Graphic representation of a populations age and sex composition
§
Constructed by joining 2 back-to-back bar graphs (male and female)
§
Provides a ‘snapshot’ of both characteristics
§
Can identify significant demographic events – e.g., epidemics, warfare,
improvements in survival
§
A simple and useful way to examine the age and sex structure of a
population
§
A pyramid is two bar-graphs back to back
§
Pyramids present “the demographic history of an area over two or three
generations”
§
Conventions: males on the left/females on the right – youngest at base of
pyramid – either single or five-year (more common) cohorts – last cohort
(80+) – bottom scale either absolute numbers or percentages – the choice
of scales affects the shape of the pyramid
§
Cohorts = 5 years; scale (absolute here, on millions); male on left/females
on right; youngest at botting, final cohort 80+
§
Concave shape “expanding” (expansive – death rate is falling (top is
extended) – characterizes less developed countries (Africa, Latin America,
etc.) – The “too much” population problem – “expansionary” growth
process
§
Beehive shape “stable” (stationary) – stable population = low death rate
and low birth rates – average age of the population is increasing –
“stationary growth process” – e.g., England, Sweden, US
§
Rectangular shape/tapered bottom “diminishing” (declining) –
constructive” growth process – similar to beehive, but with a decrease in
fertility – aging population – ‘no growth’ population problem e.g., Italy,
Germany, Japan
§
o
Pyramid types: Canada
Expanding – a broad base, indicating a high proportion of children, rapid rate of
population growth, and a low proportion of older people e.g., Nunavut is an
expansive type population pyramid
o
Stable – a narrow base and roughly equal numbers in each age group, tapering
off at the older ages e.g., Manitoba is a stationary type population pyramid
o
Diminishing – a high proportion of aged persons and declining numbers, e.g.
Newfoundland and Labrador is a declining type population pyramid
o
The cohort in 1992 in Russia is significant – the second world war
Age structure of a population
Bordeaux, France: the population of many countries and regions are aging. e.g.,
Europe and Japan
o
Aging populations: to replace the population, TFR must be ~ 2.1
- TRF in Bologna, Italy is 0.8
Important questions
Why are women having fewer children?
o
What are the impacts of an aging population on a country?
o
What are the “solutions” to an aging population?
o
Dependency ratio (DR)
A measure of the productive capacity of a population, w. respect to age
structure
o
Productive segment (PS): between 15 (or 20) and 64 years
o
Dependent segment (DS): under 15 (or 20) over 64
DR = DS/PS X 100
§
o
It measures the number of dependents that each 100 people in the productive
sector must support
o
E.g., suppose Canada has 20 million in productive segment (15-64) and 5
million in dependent segment (age 0-14, 64+)
DR = DS/PS X 100 = 5 / 20 X 100 = 25 people that each 100 people in the
productive sector have to support
§
o
Or Canada with 15 million PS and 10 million DS
DR = 10/15 x 100 = 66.6 people that every 100 working people in the
productive sector would have to support -- – put a strain on the younger
generation
§
o
High dependency ratios: a high dependency ration in itself doesn’t tell us
whether the large population is in the lower age group of higher age group – a
high dependency ration could indicate an aging population (Canada, Italy) w/ a
larger> 64 population or very young population (Ethiopia) with a large < 15
population
o
Dependency Ratios
o
A rough indicator of age distribution
o
generally, ratio of non-productive to productive age groups
o
can be affected significantly by disease, warfare, etc.
o
can be used to compare populations
o
the greater the ration the more dependent the overall population
o
What in the impact of having a high dependency ratio?
Estimates suggest the ration of dependent elderly population to working age
will double in much of developed world, will triple in much of the less-
developed world
o
The consequences include increasing stress on retirement, pension and related
social benefits. Global aging will lead to different patterns of disease and
disability. National economies will face strain as numbers of workers available
to support non-working gradually declines. Inevitable, problems of aging will
exacerbate in those parts of the world that already lack financial and other
resources.
o
Assignment:
Mainly making population graphs of Canada
o
Population Geography pt. 2(week 5 &6/ pages 1-9)
Population Geography
It is the study of the ways in which spatial variations in the distribution,
composition, migration and growth of populations are related to the nature of
places.
o
Some of these focus on
Study of people in their spatial distribution and density
§
Increase or decrease in population numbers
§
The movements and mobility of populations
§
Settlement patterns
§
The way in which places react to population phenomena (e.g.,
immigration)
§
o
Earth population is approx. 7 billion
We add 370000 babies to the Earth each Day
§
The 2012 global crude birth rate (CBR) was about 19 births per 1000 total
population (~20 in 2007)
§
Only 12 years were required for population to grow from 5 to 6 billion
people
§
o
World population distribution
90% of people live north of the Equator, 66% between 20 degrees and 60 degrees1)
More than 50% of the world’s population lives on ~5% of the land2)
Most live at low altitudes (nearly 80% below 500 metres)3)
Most live on continental margins (~60% live within 100 km of the ocean)4)
Four major cluster of settlement
East Asia Zone (China, Japan, Taiwan, and Korea)
o
South Asia (India, Pakistan and Sri Lanka)
o
European (most of Europe and Europeanised Russia)
o
Northeastern US, Southeastern Canada
o
Global distribution of population (explanation)
Physical variables
3 environments are associated w/ high population densities: monsoon,
Mediterranean, temperate forest areas
§
3 environments are associated w/ very low population densities: Desert,
tundra, polar areas
the correlation between the highest and lowers population densities
shows how humans have recognized the relative attractiveness of
certain area
§
the recognition is demonstrated especially by human’s productivity
§
§
o
Many ways of measuring population
Crude population density – measure of total population relative to land size
(arithmetic population density)
o
Crude measure
o
Doesn’t take resource into acct.
o
Continued notes on lecture Oct. 11/ page 10 and on
Thursday, October 6, 2016
Population Geography (week 5 & 6/ pages 1-27)

Age and Sex Structure:
Fertility and mortality vary significantly with age
o
Growth of a population is affected by age composition of population
o
Composition of a Population:
Population pyramids/ chart the show the percent of each group on the total
population, divided by gender – for poorer countries, the chart is shaped like a
pyramid. Infant mortality rates are high; life expectancy is shorter
Graphic representation of a populations age and sex composition
§
Constructed by joining 2 back-to-back bar graphs (male and female)
§
Provides a ‘snapshot’ of both characteristics
§
Can identify significant demographic events – e.g., epidemics, warfare,
improvements in survival
§
A simple and useful way to examine the age and sex structure of a
population
§
A pyramid is two bar-graphs back to back
§
Pyramids present “the demographic history of an area over two or three
generations”
§
Conventions: males on the left/females on the right – youngest at base of
pyramid – either single or five-year (more common) cohorts – last cohort
(80+) – bottom scale either absolute numbers or percentages – the choice
of scales affects the shape of the pyramid
§
Cohorts = 5 years; scale (absolute here, on millions); male on left/females
on right; youngest at botting, final cohort 80+
§
Concave shape “expanding” (expansive – death rate is falling (top is
extended) – characterizes less developed countries (Africa, Latin America,
etc.) – The “too much” population problem – “expansionary” growth
process
§
Beehive shape “stable” (stationary) – stable population = low death rate
and low birth rates – average age of the population is increasing –
“stationary growth process” – e.g., England, Sweden, US
§
Rectangular shape/tapered bottom “diminishing” (declining) –
constructive” growth process – similar to beehive, but with a decrease in
fertility – aging population – ‘no growth’ population problem e.g., Italy,
Germany, Japan
§
o
Pyramid types: Canada
Expanding – a broad base, indicating a high proportion of children, rapid rate of
population growth, and a low proportion of older people e.g., Nunavut is an
expansive type population pyramid
o
Stable – a narrow base and roughly equal numbers in each age group, tapering
off at the older ages e.g., Manitoba is a stationary type population pyramid
o
Diminishing – a high proportion of aged persons and declining numbers, e.g.
Newfoundland and Labrador is a declining type population pyramid
o
The cohort in 1992 in Russia is significant – the second world war
Age structure of a population
Bordeaux, France: the population of many countries and regions are aging. e.g.,
Europe and Japan
o
Aging populations: to replace the population, TFR must be ~ 2.1
- TRF in Bologna, Italy is 0.8
Important questions
Why are women having fewer children?
o
What are the impacts of an aging population on a country?
o
What are the “solutions” to an aging population?
o
Dependency ratio (DR)
A measure of the productive capacity of a population, w. respect to age
structure
o
Productive segment (PS): between 15 (or 20) and 64 years
o
Dependent segment (DS): under 15 (or 20) over 64
DR = DS/PS X 100
§
o
It measures the number of dependents that each 100 people in the productive
sector must support
o
E.g., suppose Canada has 20 million in productive segment (15-64) and 5
million in dependent segment (age 0-14, 64+)
DR = DS/PS X 100 = 5 / 20 X 100 = 25 people that each 100 people in the
productive sector have to support
§
o
Or Canada with 15 million PS and 10 million DS
DR = 10/15 x 100 = 66.6 people that every 100 working people in the
productive sector would have to support -- – put a strain on the younger
generation
§
o
High dependency ratios: a high dependency ration in itself doesn’t tell us
whether the large population is in the lower age group of higher age group – a
high dependency ration could indicate an aging population (Canada, Italy) w/ a
larger> 64 population or very young population (Ethiopia) with a large < 15
population
o
Dependency Ratios
o
A rough indicator of age distribution
o
generally, ratio of non-productive to productive age groups
o
can be affected significantly by disease, warfare, etc.
o
can be used to compare populations
o
the greater the ration the more dependent the overall population
o
What in the impact of having a high dependency ratio?
Estimates suggest the ration of dependent elderly population to working age
will double in much of developed world, will triple in much of the less-
developed world
o
The consequences include increasing stress on retirement, pension and related
social benefits. Global aging will lead to different patterns of disease and
disability. National economies will face strain as numbers of workers available
to support non-working gradually declines. Inevitable, problems of aging will
exacerbate in those parts of the world that already lack financial and other
resources.
o
Assignment:
Mainly making population graphs of Canada
o
Population Geography pt. 2(week 5 &6/ pages 1-9)
Population Geography
It is the study of the ways in which spatial variations in the distribution,
composition, migration and growth of populations are related to the nature of
places.
o
Some of these focus on
Study of people in their spatial distribution and density
§
Increase or decrease in population numbers
§
The movements and mobility of populations
§
Settlement patterns
§
The way in which places react to population phenomena (e.g.,
immigration)
§
o
Earth population is approx. 7 billion
We add 370000 babies to the Earth each Day
§
The 2012 global crude birth rate (CBR) was about 19 births per 1000 total
population (~20 in 2007)
§
Only 12 years were required for population to grow from 5 to 6 billion
people
§
o
World population distribution
90% of people live north of the Equator, 66% between 20 degrees and 60 degrees1)
More than 50% of the world’s population lives on ~5% of the land2)
Most live at low altitudes (nearly 80% below 500 metres)3)
Most live on continental margins (~60% live within 100 km of the ocean)4)
Four major cluster of settlement
East Asia Zone (China, Japan, Taiwan, and Korea)
o
South Asia (India, Pakistan and Sri Lanka)
o
European (most of Europe and Europeanised Russia)
o
Northeastern US, Southeastern Canada
o
Global distribution of population (explanation)
Physical variables
3 environments are associated w/ high population densities: monsoon,
Mediterranean, temperate forest areas
§
3 environments are associated w/ very low population densities: Desert,
tundra, polar areas
the correlation between the highest and lowers population densities
shows how humans have recognized the relative attractiveness of
certain area
§
the recognition is demonstrated especially by human’s productivity
§
§
o
Many ways of measuring population
Crude population density – measure of total population relative to land size
(arithmetic population density)
o
Crude measure
o
Doesn’t take resource into acct.
o
Continued notes on lecture Oct. 11/ page 10 and on
Thursday, October 6, 2016
Population Geography (week 5 & 6/ pages 1-27)
Document Summary
Population geography (week 5 & 6/ pages 1-27) Growth of a population is affected by age composition of population. Population pyramids/ chart the show the percent of each group on the total population, divided by gender for poorer countries, the chart is shaped like a pyramid. Infant mortality rates are high; life expectancy is shorter. Graphic representation of a populations age and sex composition. Constructed by joining 2 back-to-back bar graphs (male and female) Can identify significant demographic events e. g. , epidemics, warfare, improvements in survival. A simple and useful way to examine the age and sex structure of a population. A pyramid is two bar-graphs back to back. Pyramids present the demographic history of an area over two or three generations . Cohorts = 5 years; scale (absolute here, on millions); male on left/females on right; youngest at botting, final cohort 80+