STAT 1000 Lecture 10: STAT 1000 – Lecture 10 – Examining Distribution (Continued)
1 Mar 2018
School
Department
Course
Professor
Document Summary
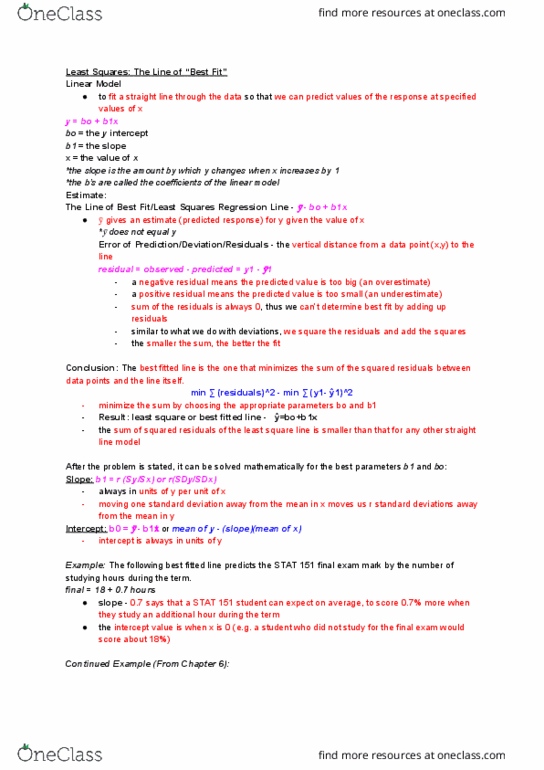
Stat 1000 lecture 10 examining distribution (continued) The scores on a scholastic test and the number of hours ten randomly selected students devoted to study are as follows: Interpret b0, b1, and r2. b1: for every additional hour spent studying, we predict the test scores will increase by. 0. 67 percent. b0: if a student did not study, we predict the would get a score of 63. 42%. r2: 21. 97% of the variation in test scores is explained by its regression on hours spent studying. As previous, outliers can be dangerous when we are calculating regression lines as seen below: When reporting this regression line, it would be most descriptive to delete the outlier. We k(cid:374)o(cid:449) that there are three di ere(cid:374)t t(cid:455)pes of outliers. So(cid:373)e (cid:449)ill a e(cid:272)t our li(cid:374)e (cid:373)ore than others. The point in blue is an outlier in the y-dire(cid:272)tio(cid:374). It has little e e(cid:272)t o(cid:374) the regressio(cid:374) li(cid:374)e and just shifts the line upwards a small amount.