PSYC 2250 Lecture Notes - Lecture 10: Line Graph, Bar Chart, Experiment

26 Jun 2018
School
Department
Course
Professor

PSYC 2250 Introduction to Psychological Research
Chapter 10 Complex Experimental Designs
When Independent variable have more than two levels
1. T-test: used when single independent variable has two levels
- Independent-group-test
- If IV has only 2 levels (e.g. level 1 and 3), a statistical test would show no curvilinear
relationship
2. Analysis of variance: used when single independent variable has more than 2 levels/ more than
one independent variables
If a curvilinear relationship is predicted:
- Must have at least 3 levels of the IV to detect it
- Psychological examples: fear and attitude change Inverted-U shape
For comparing a control group to 2 or more experimental groups
- E.g. no dog vs. small dog vs. large dog as pets for nursing home residents
When Experiment have more than one independent variable
Many DVs are affected by more than one IV simultaneously
can combine two (or more) IVs in the same experiment
“Factorial Design”
“Factorial Design”
Used when 2 or more than 2 IVs are qualitative (categorical data) and DV is quantitative (i.e,
measured on a scale)
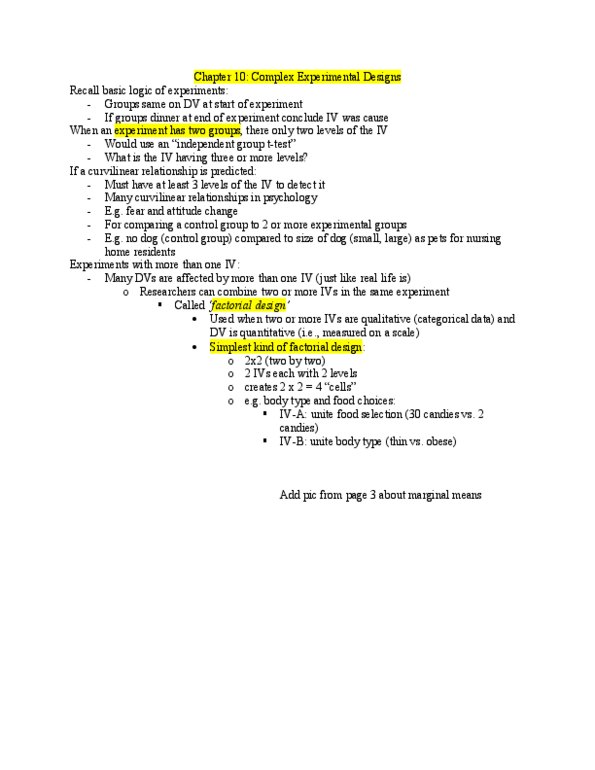
Simplest kind of factorial design:
- 2 x 2(two-by-two); 2 IVs each with 2 levels Creates 2 x 2 =4 “cells”
- Example from text: Body type and food choices
IV-A confederate food selection 30 candies VS. 2 candies
IV-B Confederate body type thin VS. Obese
DV: participant’s candy consumption
find more resources at oneclass.com
find more resources at oneclass.com
Document Summary
When independent variable have more than two levels: t-test: used when single independent variable has two levels. If iv has only 2 levels (e. g. level 1 and 3), a statistical test would show no curvilinear relationship: analysis of variance: used when single independent variable has more than 2 levels/ more than one independent variables. Must have at least 3 levels of the iv to detect it. Psychological examples: fear and attitude change inverted-u shape. For comparing a control group to 2 or more experimental groups. E. g. no dog vs. small dog vs. large dog as pets for nursing home residents. When experiment have more than one independent variable. Many dvs are affected by more than one iv simultaneously can combine two (or more) ivs in the same experiment. Used when 2 or more than 2 ivs are qualitative (categorical data) and dv is quantitative (i. e, measured on a scale)