STAT 2040 Lecture 2: unit 02

27 Feb 2018
School
Department
Course
Professor
Document Summary
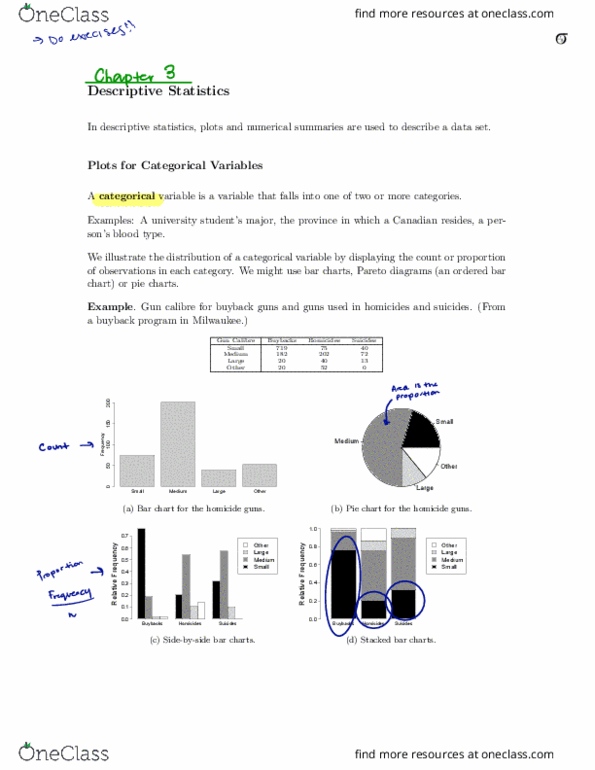
For quantitative variables, numerical summaries such as averages have meaning the variable and how often these values occur: this can be done in a variety of ways, including: Stemplots (stem-and-leaf displays: histograms, boxplots, dot plots, a histogram is a very common way of displaying quantitative data, to create a histogram, we first create a frequency table. Split each observation into a stem and a leaf. List the stems in ascending order in a column. List the leaves in ascending order next to their corresponding stem. Its an important consideration when we choose and carry out appropriate statistical inference procedure. Left skewness is not that common: distributions can also be unimodal (they have a single peak, most distributions we deal with will be unimodal. It is possible for them to be bimodal or multimodal: 3. 3: numerical measures. If n is odd, the median is the middle value.