PSYC 2360 Lecture Notes - Lecture 9: Scatter Plot, Regression Analysis, Contingency Table

20 Apr 2016
School
Department
Course
Professor
Document Summary
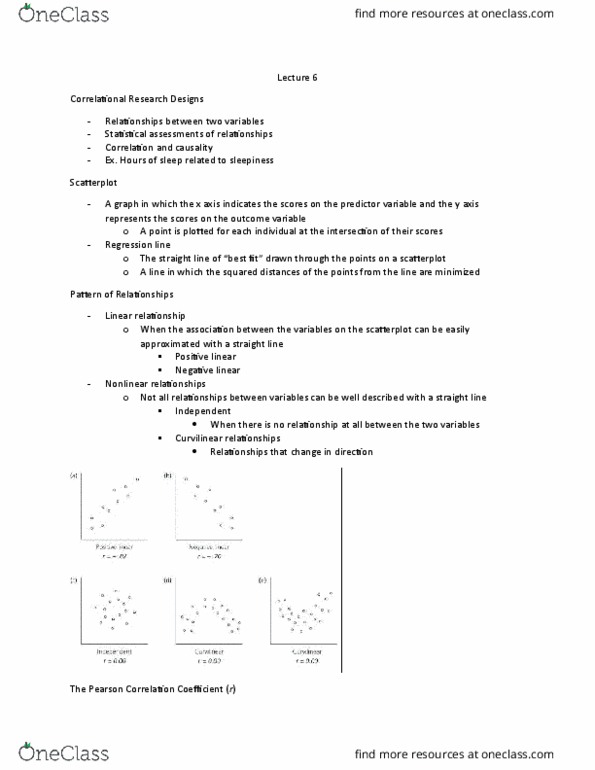
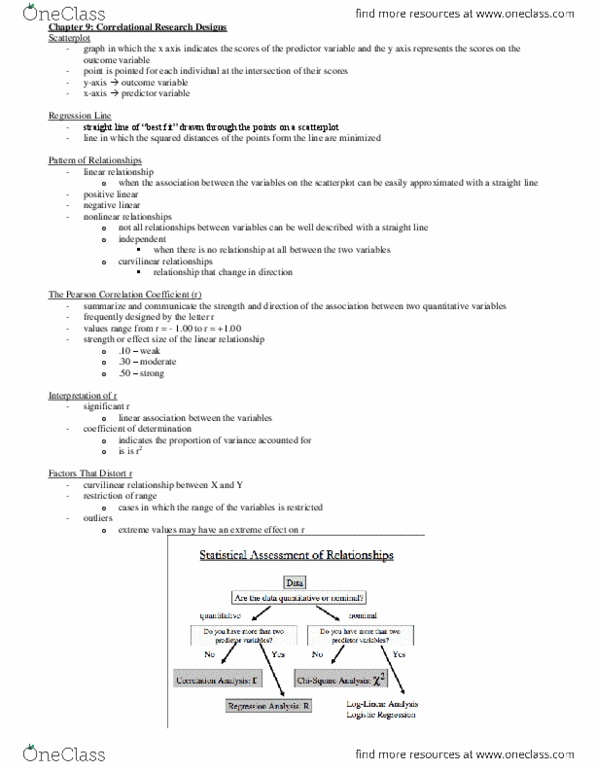
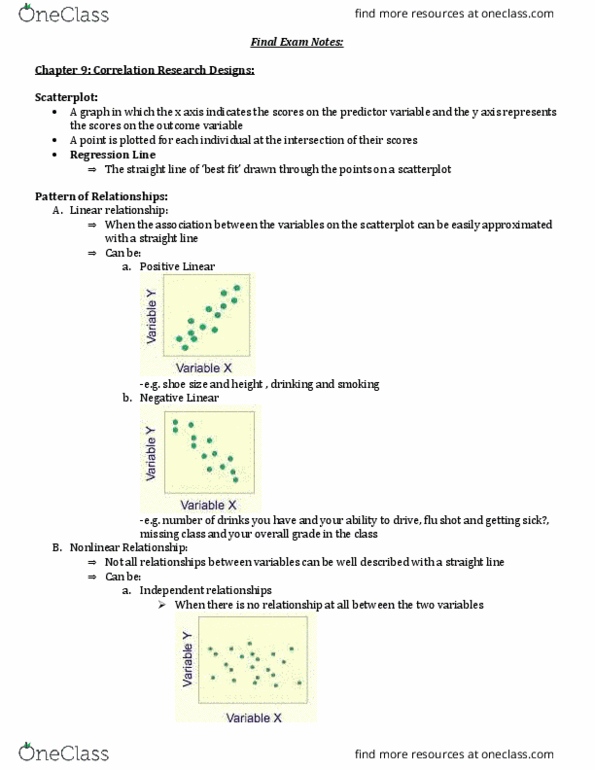
When the association between the variables on the scatterplot can be easily approximated with a straight line. Not all relationships between variables can be well described with a straight line. When there is no relationship at all between the two variables. Curvilinear relationships: relationships that change in direction, used to summarize and communicate the strength and direction of the association between two quantitative variables. Coefficient of determination: a significant r indicates there is a linear association between the variables. The proportion of variance measure for r. Cases in which there is a curvilinear relationship between x and y: restriction of range. Cases in which the range of variables is restricted. Cases in which the data have outliers. Extreme values may have an extreme effect on r. Must be used to assess the relationship between two nominal variables. Technically known as the chi-square test of independence.