POLS 3650 Lecture Notes - Lecture 14: Contingency Table, Statistical Inference, Box Plot

13 Mar 2018
School
Department
Course
Professor
Document Summary
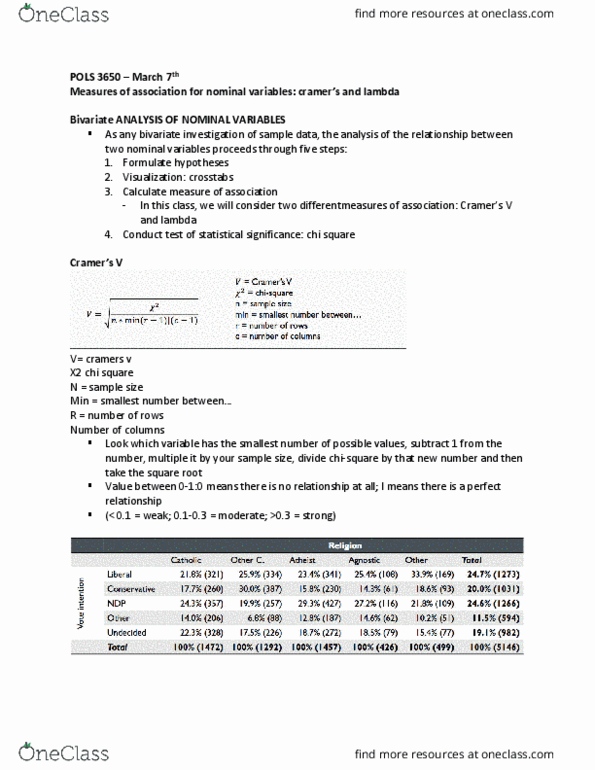
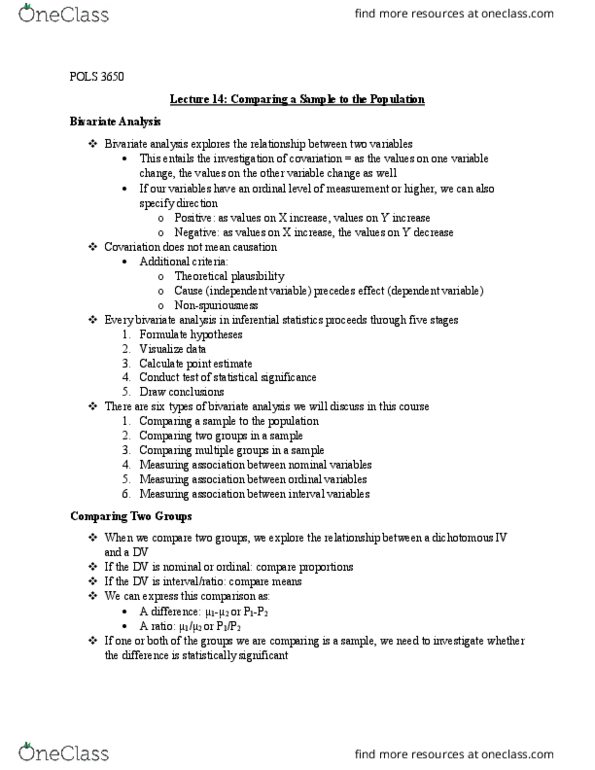
Bivariate visualization: remember: every bivariate analysis in inferential statistics proceeds through five stages. In this course, we will consider three different types of visualization of bivariate findings. Crosstabs: when we investigate the relationshop between two variables that are nominal or ordinal, we can visualize this relationship in a crosstab. Only easy to interpret when the number of values on both variables is reasonably small: example: we investigate whether religion (iv) has an influence on party preference (dv) Hi: there is a relationship between religion and party preference. Ho: there is no relationship between religion and party preference. Not a measure of association but will produce a p value in order to assess whether we find something statistically significant. In the following three lecture we will discuss bivariates statistics for nominal and ordinal variables: measures of association. Gamma and tau (march 12: statistical significance tests.