ECON 1050 Lecture Notes - Lecture 7: Outsourcing, Bovine Spongiform Encephalopathy, Trade War

20 Dec 2016
School
Department
Course
Professor
Document Summary
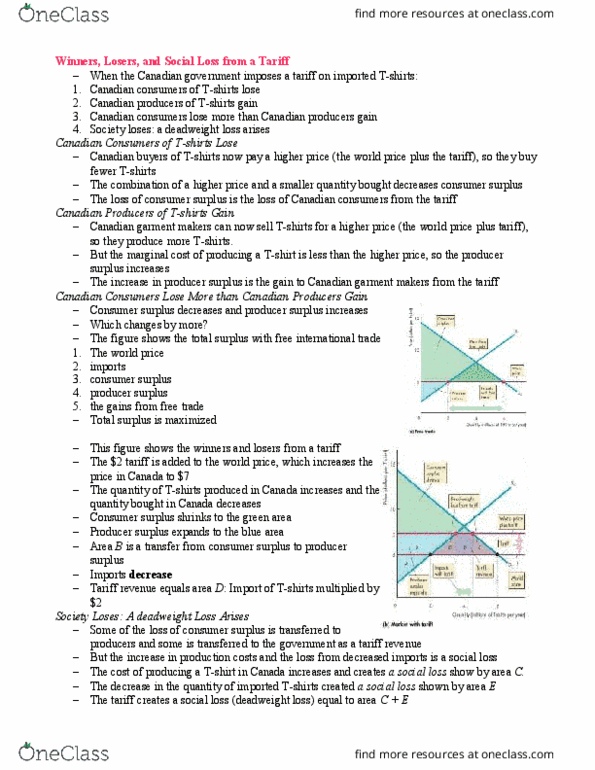
Figure 7. 5 (a) shows the situation with free international trade. Canada produces 2 million t- shirts per year and imports 4 million a year at the world price of a shirt. Figure 7. 5 (b) shows what happens when the canadian government imposes a tariff of per t-shirt: the following changes occur in the market for t-shirts in canada. To buy a t-shirt, canadians must pay the world price plus the tariff, so the price of a t-shirt rises by the tariff to . Figure 7. 5 (b) shows the new domestic price line. The price rises by the full amount of the tariff. The buyer paus the entire tariff because supply for the rest of the world is perfectly elastic. Decrease in purchases the higher price of a t-shirt brings a decrease in the quantity demanded along the demand curve. Figure 7. 5 (b) shows the decrease from 6 million shirts a year at.