BIOL 2060 Lecture Notes - Lecture 6: Net Reproduction Rate, Top Hat, Generation Time

21 Aug 2018
School
Department
Course
Professor
Document Summary
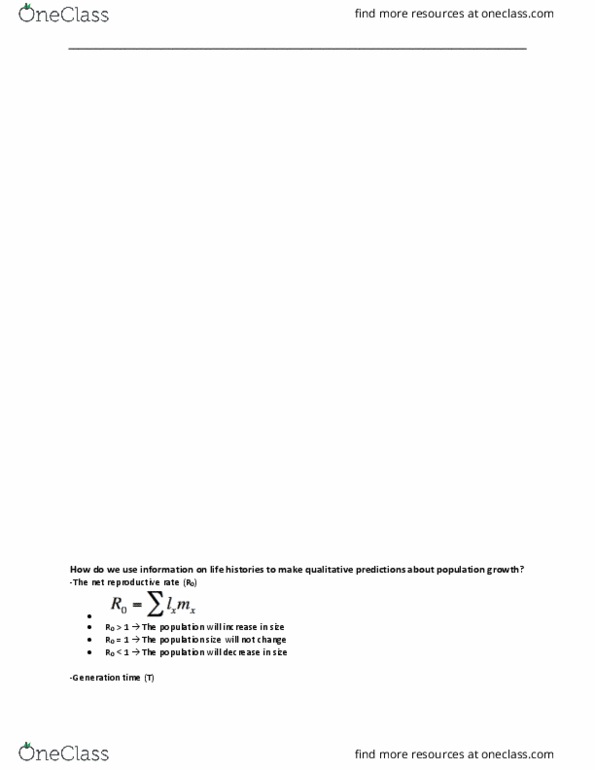
Invest less in offspring (e. g. birds and reptiles: constant survival probability. Examples of type 3 survivorship curve: plants or insects, plants: produce many seeds. Calculating survivorship in red squirrel (cohort life table: 1989-2008) Cross sectional life table red squirrels (1998: more 3 year olds than 2 year olds- survival probabilities have changed through time, survival of birth from one year of age is not constant. In a cohort, the numbers have to go down but in cross sectional it can go up or down. If every female is producing one daughter, she"s simply replacing herself. If every female produces 2, then population is doubling. If female produces half a daughter in her life, then population is shrinking: net reproductive rate can never be negative. What was the net reproductive rate for red squirrels. Intrinsic rate of increase (r: estimates the populations capacity for growth given its patterns of survivorship, its patterns of fertility and its development time.