describe the definitions of substrate, enzyme active site and its general characteristics, and apoand
holo-enzymes.
· describe the fact that enzyme catalysis is specific in terms of the type of reaction and the exact
substrate structure.
· Explain the difference in the âlock-and-keyâ model and the induced fit model of enzyme
substrate interaction.
· describe that reaction rate constant thus reaction rate is dependent on the activation energy.
· describe the relationship between the energy of the transition state and the activation energy.
· describe the relative binding affinity of a substrate and its transition state to the enzyme.
· Explain how enzymes speed up reaction rate, i.e., how do enzymes lower the activation
energy. Note: Factors other than preferential stabilization of transition state also contribute to increased
reaction rate. They include 1) enzymes placing one substrate (reactant) next to the other substrate (reactant)
so that the reaction is no longer dependent on the collision rate of the two substrates; 2) enzymes sequester the
substrate(s), minimizing solvent competition thus speeding up the reaction; 3) in enzyme complexes with each
enzyme catalyzing one step in a multi-step reaction sequence, the product of one reaction is fed to the active site
of another enzyme for the next step without the product diffusing away from the enzyme complex thereby
increasing reaction rate.
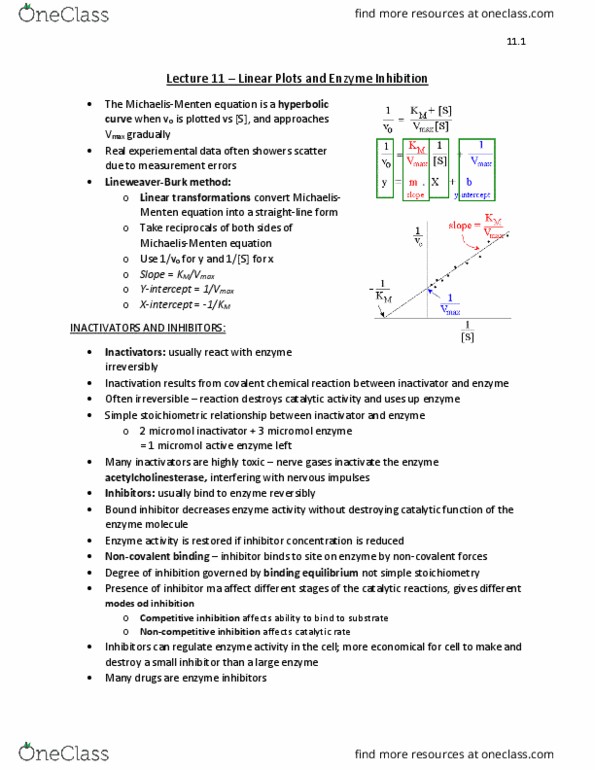
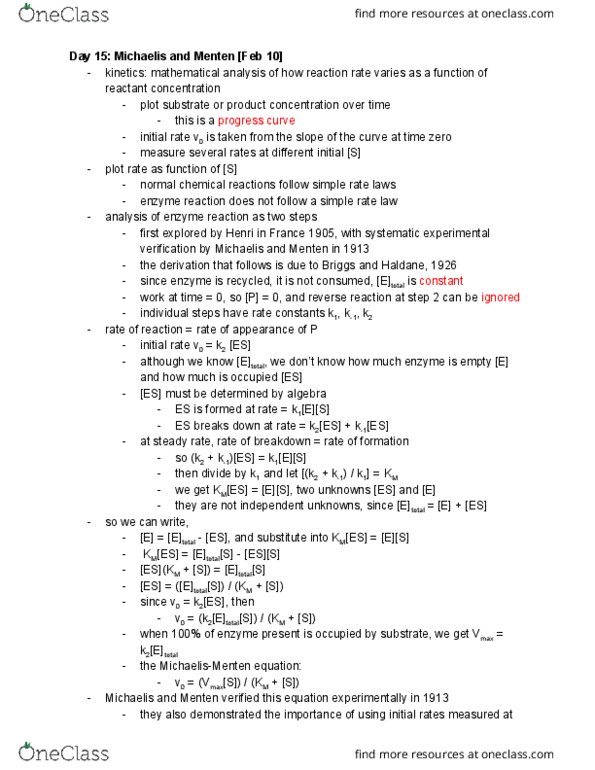
· describe the Michaelis-Menten equation relating the initial velocity to total substrate
concentration.
· describe the assumptions that went into the derivation of the Michaelis-Menten equation. ([E]
is constant, steady state assumption, etc)
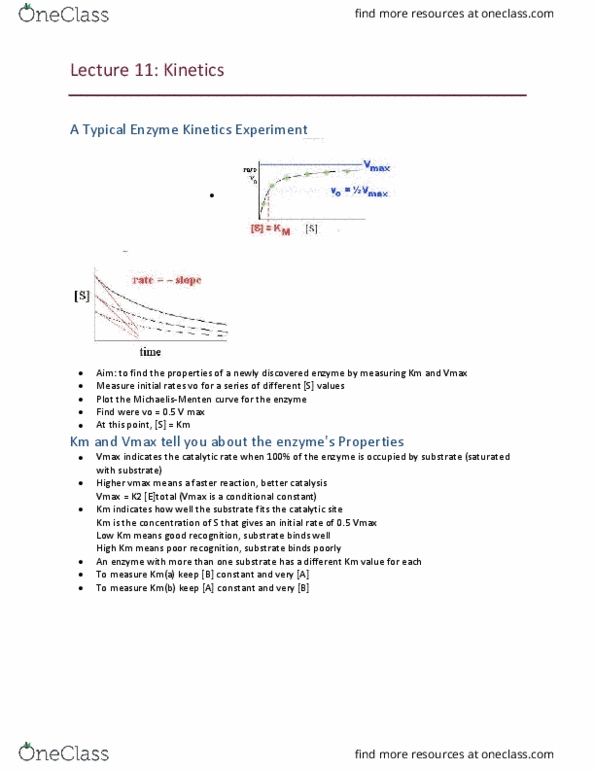
· describe the relationship between Vmax and kcat and the fact that kcat is a constant for a given
enzyme and substrate at a given temperature and solution condition; whereas Vmax can differ
for a given enzyme and substrate at a given temperature and solution condition, depending
on the enzyme concentration.
· describe the definition of Kd (equilibrium dissociation constant for ES into E and S).
· describe the relationship between Kd and the affinity of substrate for the enzyme, i.e., the
higher the Kd, the weaker the binding between E and S.
· describe the relationship between Kd and Km, i.e., in general, the higher the Kd, the higher theKm.
· Use the Michaelis-Menten equation and the relationship between Vmax and kcat to do
calculations.
· describe the other names for the catalytic rate constant, kcat (i.e., the turn over number; also
called krelease) and why it is so called (kcat reports on per unit time per enzyme molecule the
number of product molecules formed/released, thus the name turnover number or krelease).
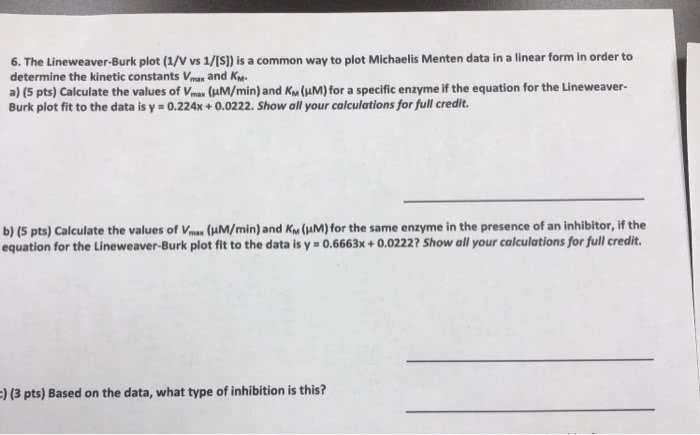
· Determine Vmax and Km using both the Michaelis-Menten plot (initial velocity versus [S]) and
the Lineweaver-Burk Plot (the double reciprocal plot), given the data of initial velocity and
[S].
· Draw the Michaelis-Menten plot AND the double reciprocal plot (Lineweaver Burk), given
the Vmax and Km values.
· describe the fact that the term kcat/Km is the best parameter for measuring the catalytic
capability (efficiency) of an enzyme.
· describe the existence of irreversible enzyme inhibition and the general mechanisms of
irreversible inhibition.
· describe the different types of reversible inhibitions, namely the competitive, uncompetitive,
and mixed inhibitions (noncompetitive inhibition is a special case in which the inhibitor
binds E and ES with equal affinity therefore α is equal to αâ â Km is not affected).
· Describe each type of inhibition in terms of inhibitor binding site (active site or other than
the active site), how the inhibitor affects vmax and Km and the quantitative relationship of
each parameter with and without the inhibitor present and their relationship with [I] and KI
or KI
â
.
· Show the characteristics of each type of inhibition on a Michaelis-Menten plot (initial
velocity versus total substrate concentration), i.e. draw the curves with and without the
competitive inhibitor.
· Show the characteristics of each type of inhibition on a double reciprocal plot (LineweaverBurk
Plot) by drawing the lines with and without the competitive inhibitor.
· Given the Michaelis-Menten or double reciprocal plot with and without the inhibitor,
determine the type of inhibitor.
· describe the fact that transition state analogs are potent inhibitors.
· Explain why transition state analogs are potent inhibitors.
· describe that not all enzymes obey Michaelis-Menten kinetics.
· describe situations when an enzyme will not obey Michaelis-Menten kinetics (when the enzyme
catalyzes reactions with multiple substrates or when the enzyme is allosteric, i.e. binding of
the substrate at one active site affects the other active site(s) for the same substrate).
· Name the four types of catalytic mechanisms. (electrostatic catalysis, general/specific acid
base catalysis, metal ion catalysis, covalent catalysis)
· Contrast acid/base catalysis to general acid/base catalysis, i.e., comment on their similarity
and difference.
· Name the eight common general acid/base pairs in proteins and write the formula of the
acid and base form for each pair (hint: consider the eight amino acids that have ionizable
side chainsâ¦)
· describe the meaning of covalent catalysis.
· describe the reaction catalyzed by chymotrypsin and the three catalytic residues in
chymotrypsin.
· Draw the interactions among the three catalytic residues (catalytic triad).
· State the catalytic role of each of the catalytic residues and how they accomplish that.
· describe the steps in the formation of the acyl-enzyme intermediate, and the substrate and
products in this first part of the chymotrypsin mechanism.
· Draw the transition state structure for the formation of the acyl-enzyme intermediate and
indicate by drawing how it is preferentially stabilized.
· describe the steps in the regeneration of chymotrypsin (deacylation), the substrates and
product of this second part of the chymotrypsin mechanism.
· Draw the transition state for deacylation and explain how it is preferentially bound to or
stabilized by the enzyme.
· Explain what general acid and base catalysis refers to and what groups act as the general acid
and base in the chymotrypsin mechanism.
· Explain what covalent catalysis refers to in the chymotrypsin mechanism.
· Explain the basis for the substrate specificity of chymotrypsin (consider the composition of
the active site â chymotrypsin specifically cleaves peptide bonds adjacent to aromatic
residues)
· Explain the term âserine proteaseâ. Answer: these are proteases (enzymes that
hydrolyze peptide bonds) that have serine as a catalytic residue (that acts as a
nucleophile, which can attack the carbonyl carbon of the peptide bond).
· Key features of Hexokinase, enolase and lysozyme mechanisms that were discussed in class
(specific methods of catalysis utilized by these enzymes; general description of overall
catalytic transformation)
· describe the four regulatory strategies of enzyme catalysis
· describe the definition of feedback inhibition (mechanism of cellular regulation that regards an
enzyme that catalyzes the production of a given substance that then inhibits the cell when
concentration of that substance has reached an appropriate level â this balances/regulates
amount of product provided with amount needed)
· describe the most common type of covalent modification and the types of enzymes
responsible for the addition and removal of the chemical group in this covalent
modification.
· Explain the general mechanism of phosphorylation in regulating enzyme activity.
· describe the general naming scheme for active and inactive proteases.
· describe that protease inhibitors exist to inhibit protease.
· describe that enzymes are regulated through covalent and non-covalent processes.
· Noncovalent regulation
o Describe noncovalent modification in general terms. Elaborate on the relation
among enzyme activity, allostery, effector molecules (small molecules) and control
proteins.
o Concerning allosteric regulation, some enzymes have multiple active sites for the
same substrate and the binding of the substrate increases the activity of the enzyme
by stabilizing the R (more active) state over the T (relatively inactive) state. (Lecture
13: âNoncovalent Modification: Allosteric Regulatorsâ)
à Draw a curve for the initial reaction velocity versus substrate concentration.
à describe and explain the specific shape of the v0 vs. [S] plot.
à Draw on the same graph above a v0 vs. [S] curve for the enzyme in the
absence of allostery. and how th i.e., in the absence of conformational change
upon substrate binding. Comment on the shape of this curve.
à Comment on the benefit of allosteric activation.
à When an inhibitor is present for such an allosteric enzyme, the v0 versus [S]
plot will shift. Draw a v0 vs. [S] curve with and without the inhibitor.
à When an activator is present for such an allosteric enzyme, the v0 versus [S]
plot will shift. Draw a v0 vs. [S] curve with and without the inhibitor.
à When an activator is present for such an allosteric enzyme, the v0 versus.
à describe the relationship between feedback inhibition and allosteric regulation
and the reason behind the term âfeedback inhibitionâ.
· Covalent regulation
o describe the most common covalent modification, the enzymes that catalyze the
modification and the removal of that modification, respectively and the amino acid
residues that tend to be the site of this modification.
o Write the structure of the added group bonded to those residues and the reaction for
this covalent modification.
o Rationalize the effectiveness of phosphorylation on altering the activity of an
enzyme.
o describe the mechanism of chymotrypsinogen activation to chymotrypsin (cleavage of
zymogen by trypsin).