STAT151 Lecture Notes - Lecture 24: Confidence Interval, Null Hypothesis, Calculator Input Methods

30 Mar 2016
School
Department
Course
Professor


4
STAT151 Full Course Notes
Verified Note
4 documents
Document Summary
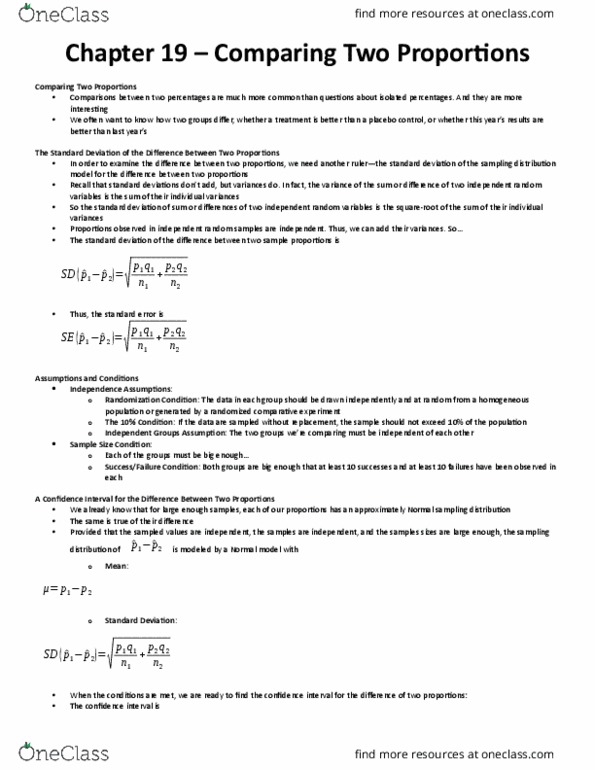
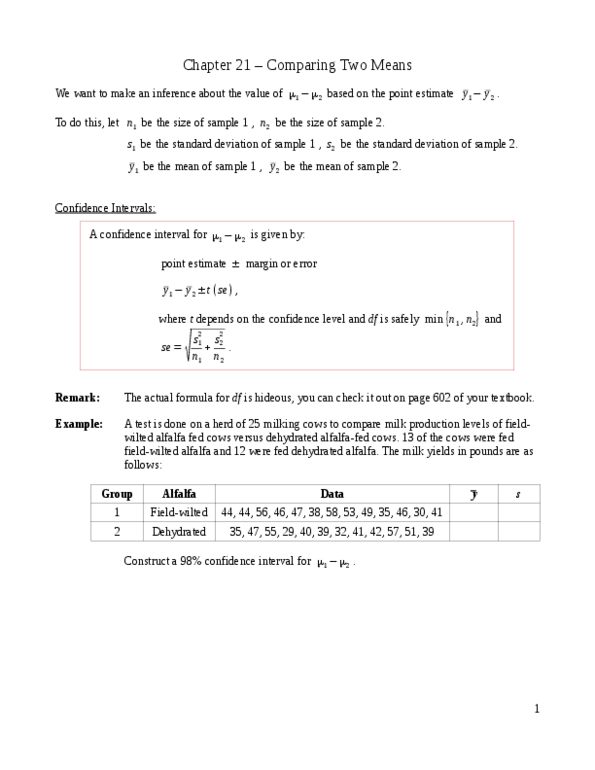
Comparing the means of independent samples - plot the data. The natural display for comparing two groups is boxplots of the data for the two groups, placed sideby-side. From this plot, we can get some idea about two sets of data, their mean, variaion, and outliers, if any are present. Once we have examined the side-by-side boxplots, we can turn to the comparison of two means. This ime the parameter of interest is the diference between the two means, 1 2. The staisic of interest is the diference in the two observed means. Remember that, for independent random quaniies, variances add. So, the standard deviaion of the diference between two sample means is. Sd ( y , y 2)= 2 n1. We sill don"t know the true standard deviaions of the two groups, so we need to esimate and use the standard error. Sd ( y , y 2)= s1 n1.