STAT151 Lecture Notes - Squared Deviations From The Mean, Quartile, Yii

7 Mar 2014
School
Department
Course
Professor


4
STAT151 Full Course Notes
Verified Note
4 documents
Document Summary
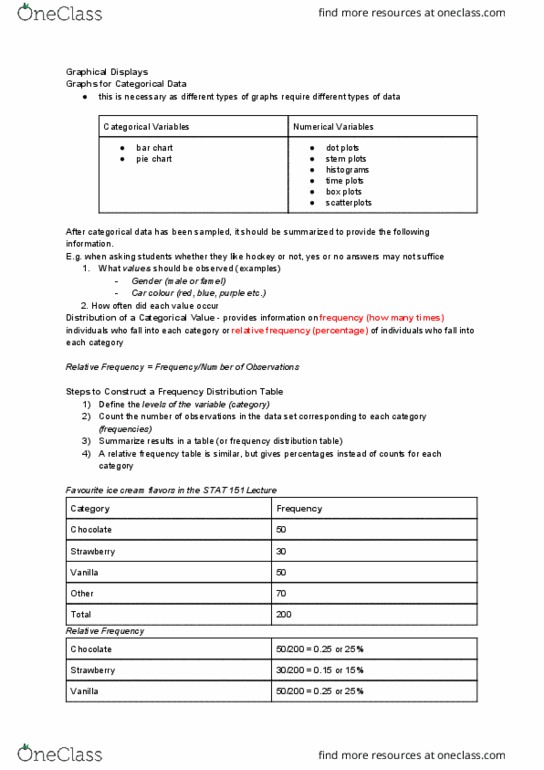
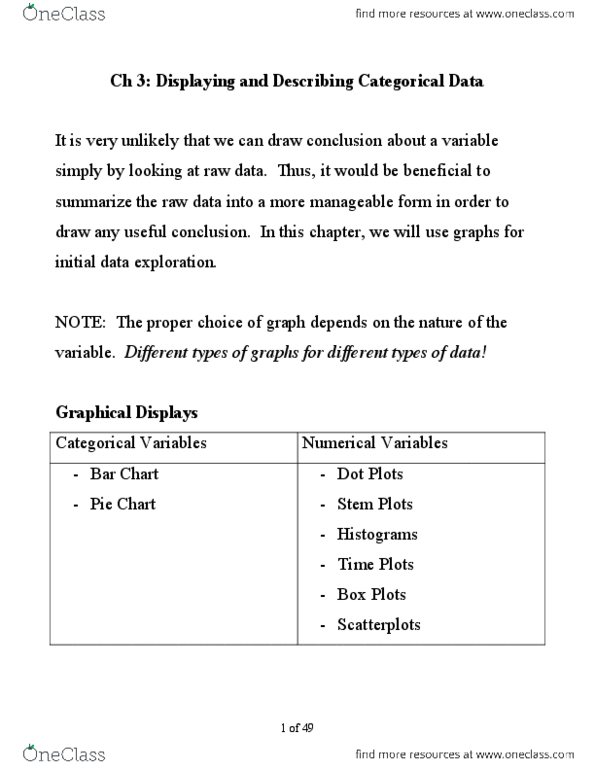
It is very unlikely that we can draw conclusion about a variable simply by looking at raw data. Thus, it would be beneficial to summarize the raw data into a more manageable form in order to draw any useful conclusion. In this chapter, we will use graphs for initial data exploration. Note: the proper choice of graph depends on the nature of the variable. Different types of graphs for different types of data! Ex: car color: red, white, blue, black, other. The distribution of a categorical variable is given in form of a table providing with the following information: Frequency (or number) of individuals who fall into each category or. Relative frequency (or percentage) of individuals who fall into each category. The relative frequency for a particular category is the percentage of the frequency that the category appears in the data set. 2 of 49 nsobservatioofnumberfrequencyfrequencyrelative steps to construct a frequency or relative frequency.