STAT151 Lecture Notes - Dependent And Independent Variables, Lincoln Near-Earth Asteroid Research, Standard Deviation

19 Sep 2013
School
Department
Course
Professor


4
STAT151 Full Course Notes
Verified Note
4 documents
Document Summary
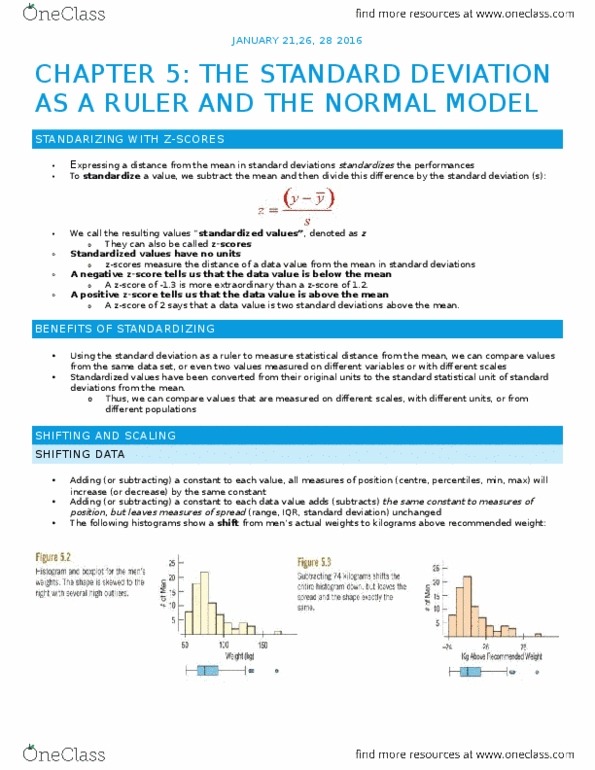
*** fun fact: if you go 5 standard deviations from the mean on either side, then the amount of observations included are 99. 99994% (far less chance of error) *** The z-score tells us how many standard deviations an observation is from the mean it is not a probability (despite its appearance) Bivariate data data where two numerical variables are related. When using bivariate data, which one is which does matter because one variable is predicted based on the other! Association something that exists between two variables if they are related such that a variable value is more likely to occur with certain value(s) of the other. (this is different from correlation!!) A scatterplot is used to graph the two corresponding numerical values (one will be along the x-axis and the other will be along the y-axis: dependant variable on the y-axis, look for: