PEDS109 Lecture Notes - Vo2 Max, Scatter Plot, Statistical Hypothesis Testing

28 Apr 2013
School
Department
Course
Professor
Document Summary
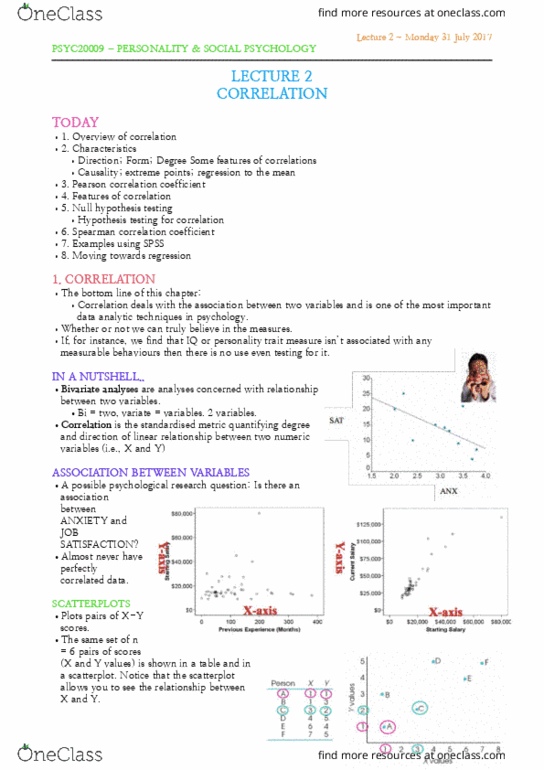
In correlation we ask if there is a relationship between x and y. Each individual or object must have measurements relating to 2 variables (ex. Confidence and anxiety scores in a person to assess correlation) If you can create a scatterplot, we can see a correlation in data and a good chance we are doing a correlation question in the exam. Form/shape of relationship: correlations only work in linear relationships. Degree/strength of the relationship: correlation measures test the degree to which the data fit the model, the greater the devialtion from the straight line, the weaker the correlation. If you get a numerical value for a correlational coefficient that is greater than. 1 or less than -1, you have made a mistake: as correlation goes closer to 1, correlation gets stronger, as correlation goes closer to -1, correlation gets weaker.