PEDS109 Lecture Notes - Interquartile Range, Quartile, Normal Distribution

28 Apr 2013
School
Department
Course
Professor
Document Summary
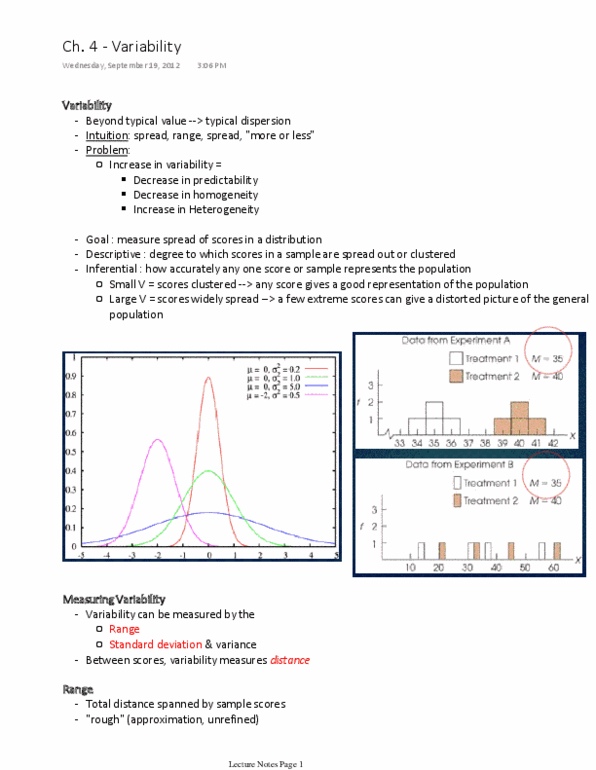
Heterogeneity: ex of a homogenous data set taking the top 100 golfers in teh world and looking at their typical scores on a golf course. Heterogeneity data set if we randomly selected 100 golfers of various skill levels and compared scores, the scores would be widely spread out. There is more variation in abilities and variations of scores: homogenous data sets are bad for finding correlational studies. Once we get a greater spread of scores, the underlying relationship between variables will come to light. Range: range is the distance between the largest score (xmax) and lowest score (xmin) in a distribution, this means the range and variation of the scores is calculated by 2 data points. Its risky because all sort of things can happen between these 2 scores, then we are distorting the distributional characteristics: ex. So 30. 5 22. 5 = 8: even though the range is 8 we would likely put 22. 5 30. 5.