PSYC 201W Lecture Notes - Lecture 14: Statistical Inference, Level Of Measurement, Scatter Plot

24 Nov 2018
School
Department
Course
Professor
Document Summary
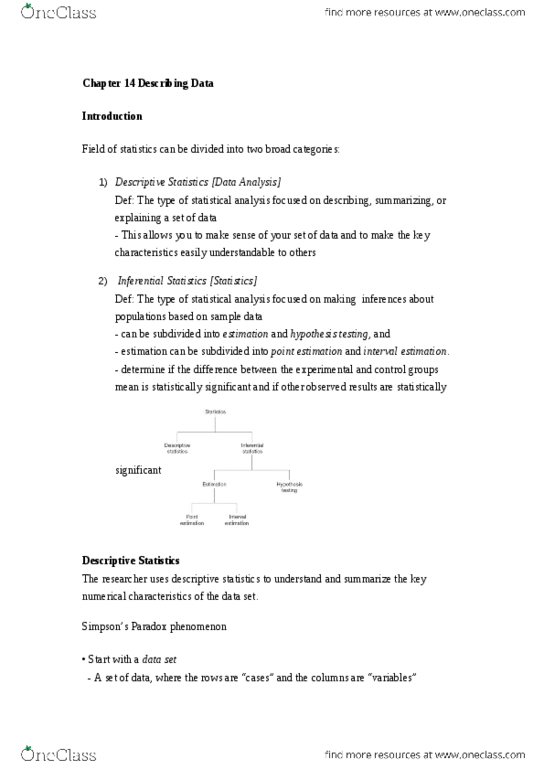
Chapter 14: type of analysis focused on describing, summarizing, or explaining sets of data. Statistics (inferential statistics: type of analysis focused on making inferences about populations based on sample data, starts with data set, to understand and summarize the key numerical characteristics of the data set. Means, frequencies, graphs: scales of measurement: nominal, ordinal, interval, ratio. Types of data: continuous/quasi-continuous dv, central tendency and variability, frequency/categorical data, counts, percentages, proportions, bivariate data, 2 continuous or quasi-continuous variables, scatterplot type and strength. Measures of central tendency: mean = average, median = center point, mode = most frequently occurring number in data set. Measure of variability: numerical value expressing how spread out of how much variation is present in the values of a quantitative variable. Unstandardized difference between means: comparison of mean differences (dv) between levels of a categorical iv. Standardized difference between means: effect size indicator, cohen"s d.