Can some do this ?
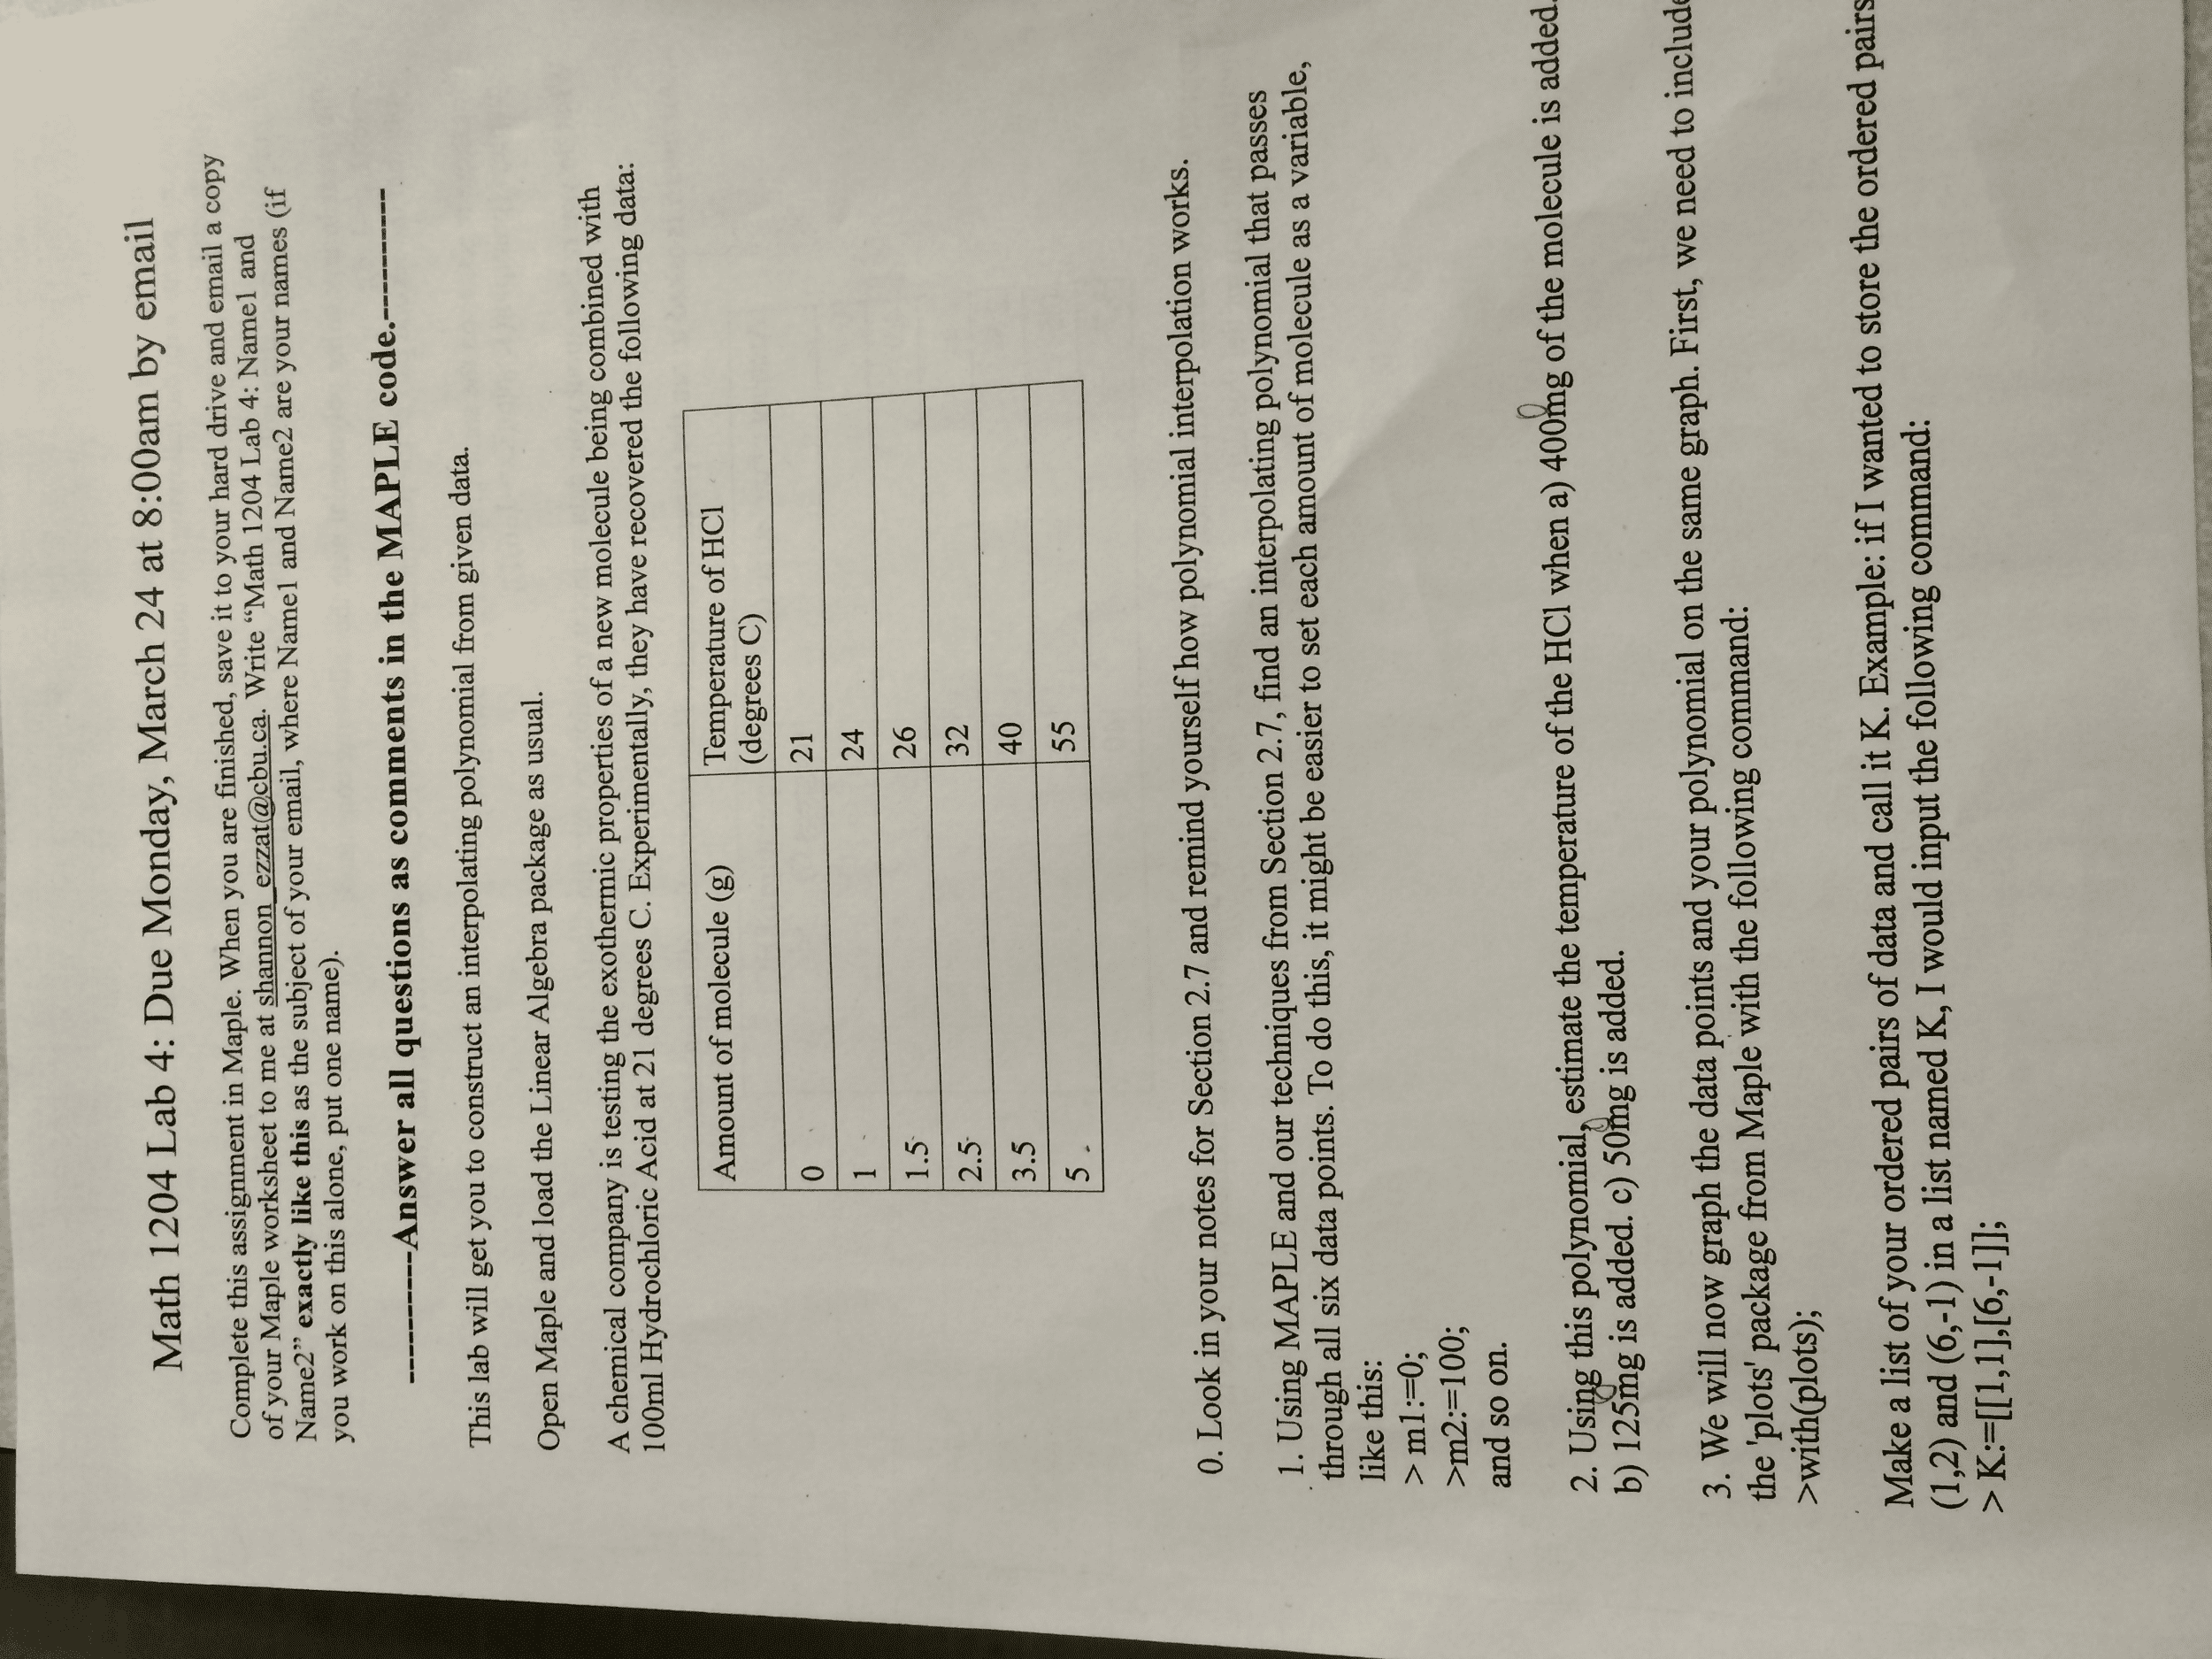
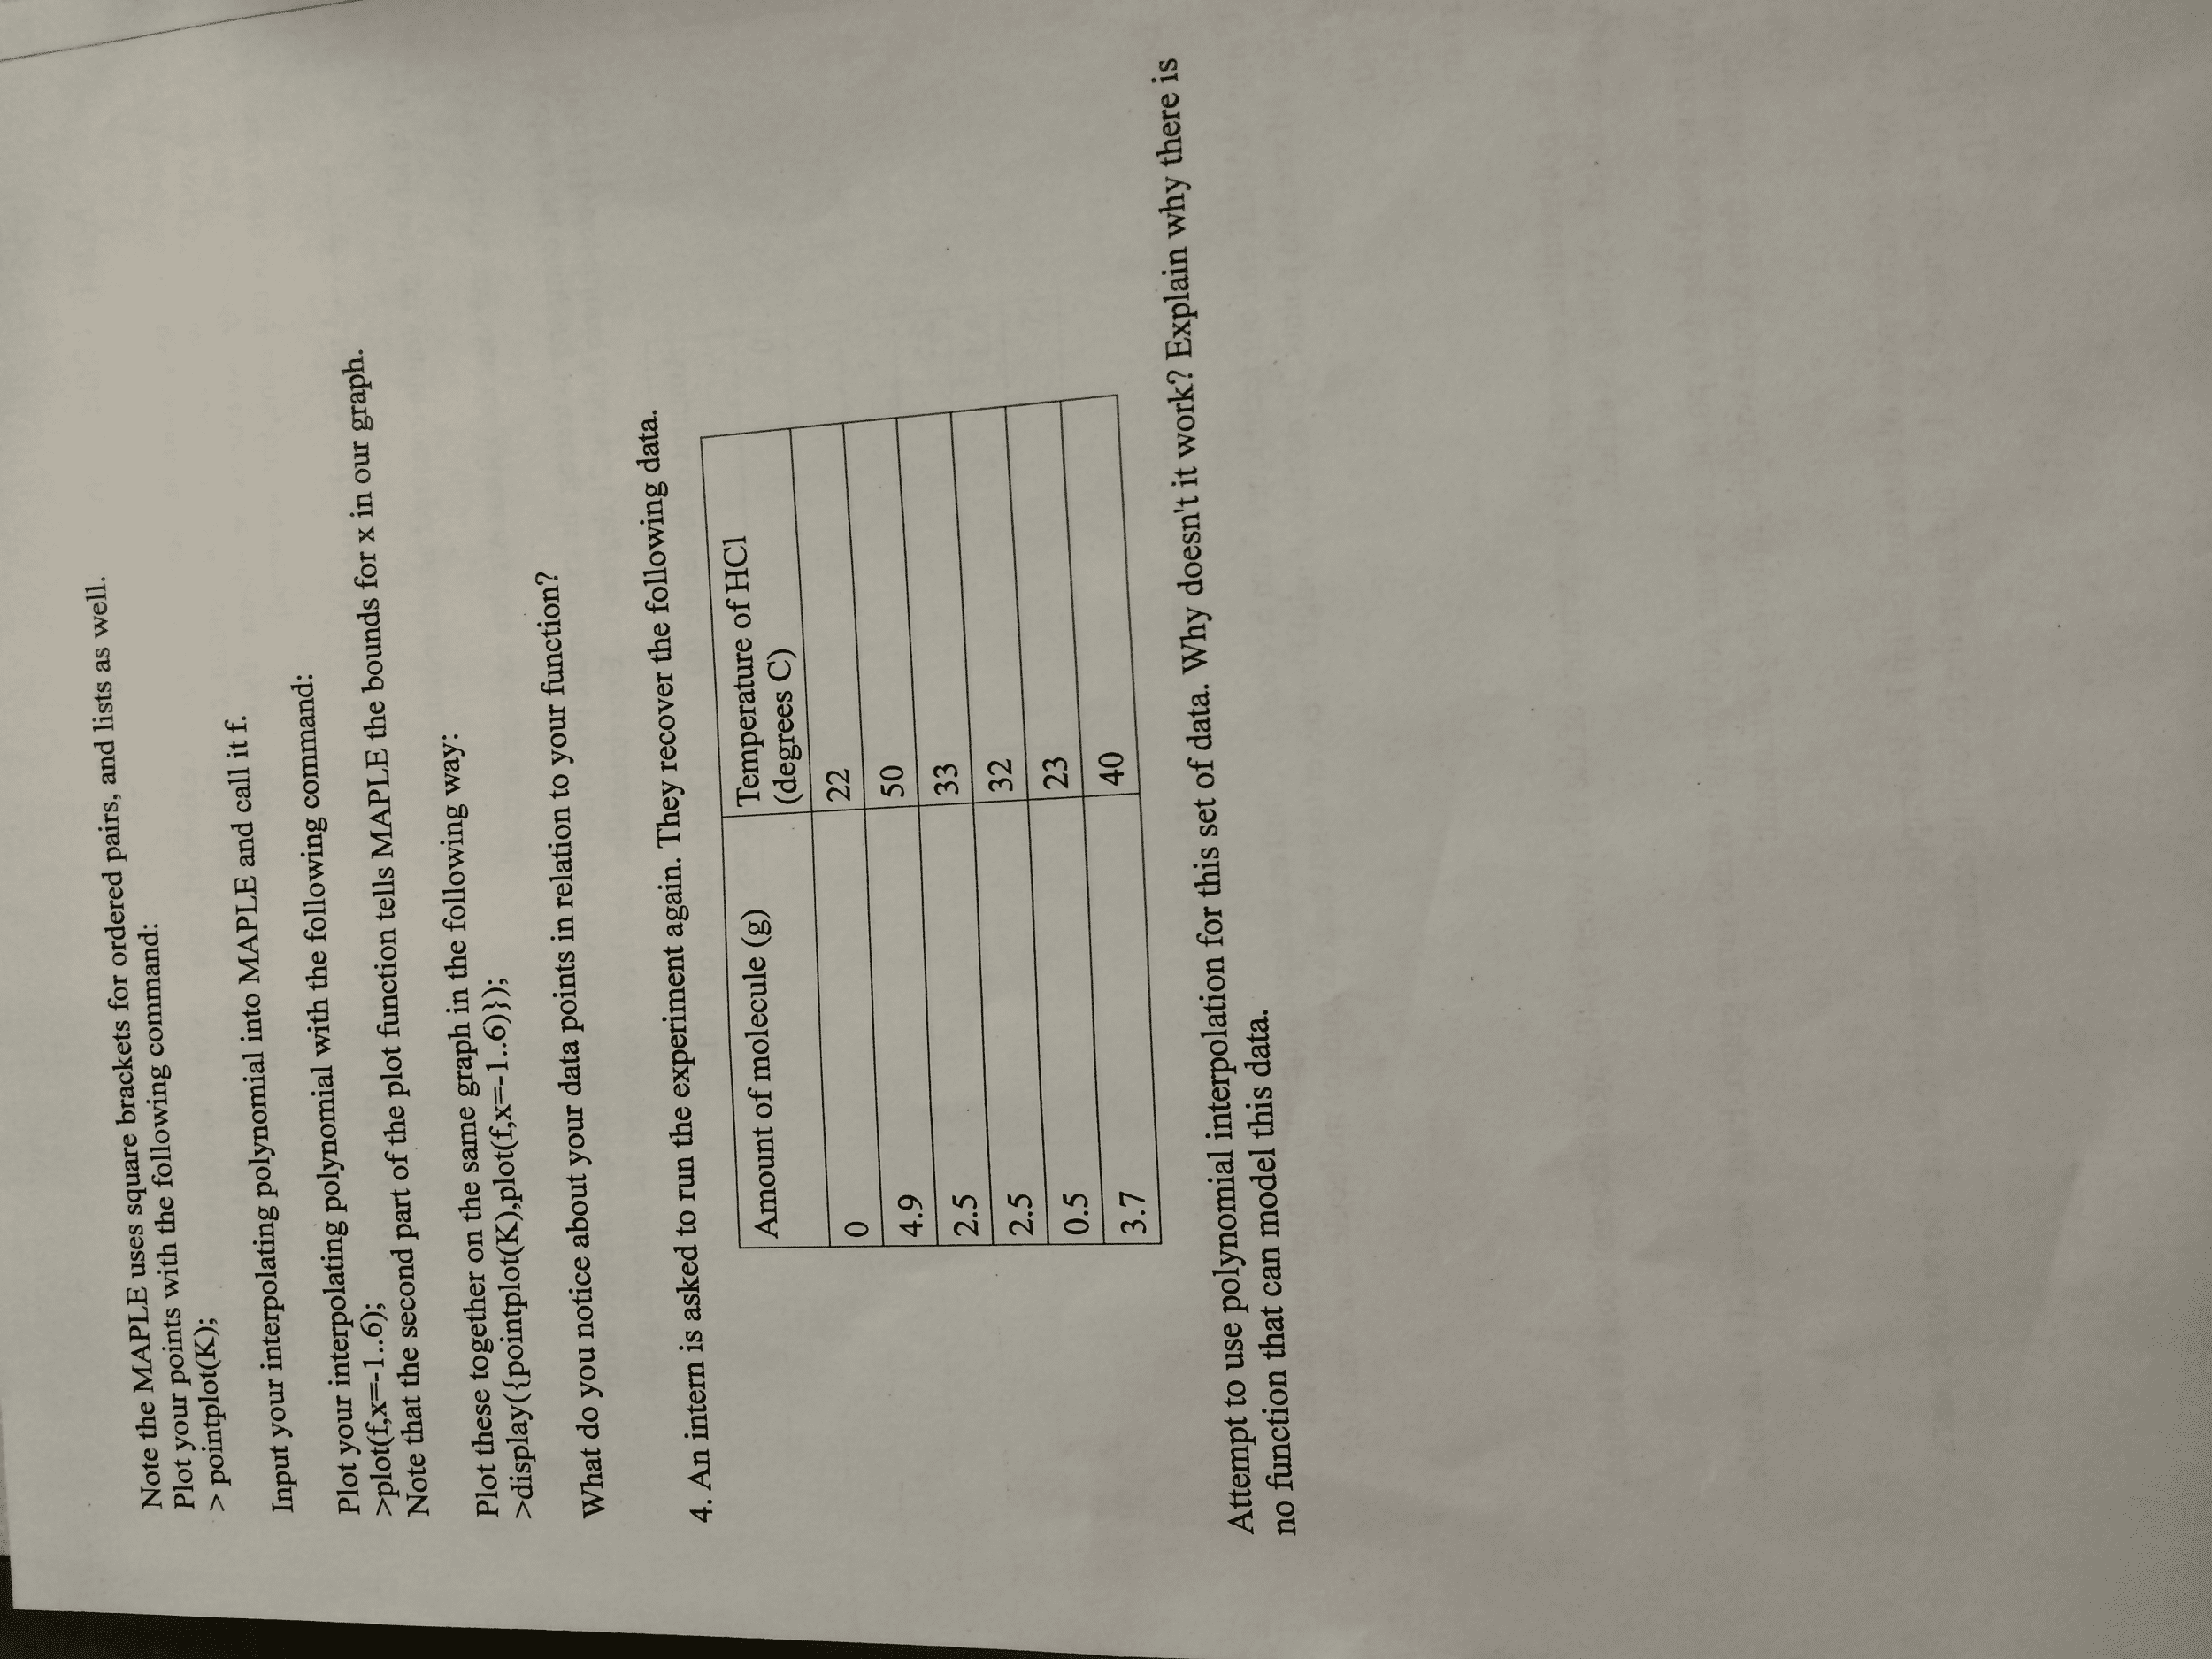
Complete this assignment in Maple. When you are finished, save it to your hard drive and email a copy of your Maple worksheet to me at Write "Math 1204 Lab 4: Name1 and Name2" exactly like this as the subject of your email, where Name1 and Name2 are your names (if you work on this alone, put one name). This lab will get you to construct an interpolating polynomial from given data. Open Maple and load the Linear Algebra package as usual. A chemical company is testing the exothermic properties of a new molecule being combined with 100 ml Hydrochloric Acid at 21 degrees C. Experimentally, they have recovered the following data: Look in your notes for Section 2.7 and remind yourself how polynomial interpolation works. Using MAPLE and our techniques from Section 2.7, find an interpolating polynomial that passes through all six data points. To do this, it might be easier to set each amount of molecule as a variable, like this: and so on. Using this polynomial estimate the temperature of the HCl when 400 mg of the molecule is added 125 mg is added. 50 mg is added. We will now graph the data points and your polynomial on the same graph. First, we need to include the 'plots' package from Maple with the following command: > with (plots); Make a list of your ordered pairs of data and call it K. Example: if I wanted to store the ordered pairs (1, 2) and (6, -1) in a list named K, I would input the following command: > K: [[1, 1], [6, -1]]; Note the MAPLE uses square brackets for ordered pairs, and lists as well. Plot your points with the following command: > pointplot(K); Input your interpolating polynomial into MAPLE and call it f. Plot your interpolating polynomial with the following command: > plot(f, x = 1..6); Note that the second part of the plot function tells MAPLE the bounds for x in our graph. Plot these together on the plot function tells MAPLE the bounds for x in our graph. Plot these together on the same graph in the following way: > display ({pointplote(K), plot(f,x=-1..6)}); What do you notice about your data points in relation to your function? An intern is asked to run the experiment again. They recover the following data. Attempt to use polynomial interpolation for this set of data. Why doesn't work? Explain why there is no function that can model this data.


