QMS 102 Lecture Notes - Central Tendency, Weighted Arithmetic Mean, Cumulative Frequency Analysis

22 Jun 2012
School
Department
Course
Professor
Document Summary
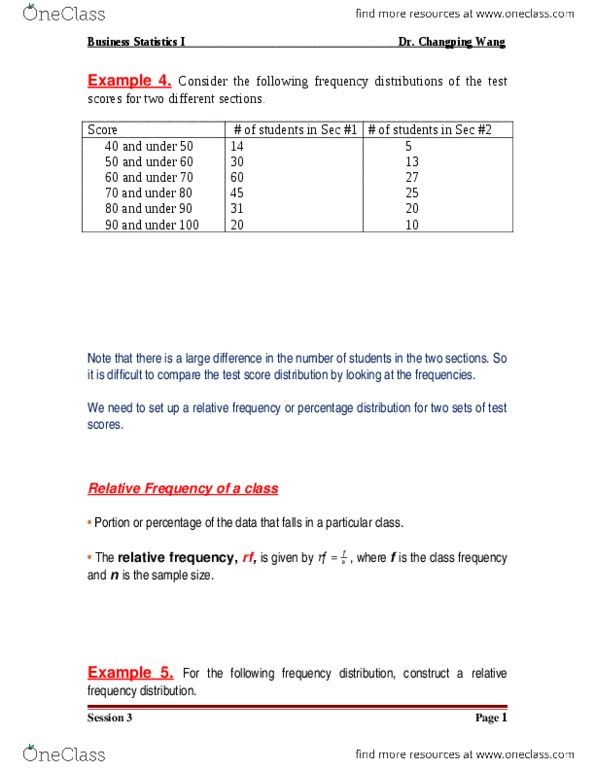
Consider the following frequency distributions of manufacturing personnel salaries at abc and xyz inc. Note that there is a large difference in the number of employees in the two companies. So it is difficult to compare the salary distribution by looking at the frequencies. We need to set up a relative frequency or percentage distribution for two sets of salaries. Relative frequency of a class: portion or percentage of the data that falls in a particular class, the relative frequency, rf, is given by frequency and n is the sample size. The following sample data set lists the number of minutes 50 internet subscribers spent on the internet during their most frequency distribution following the rule in the text. One question cannot be answered using the relative frequency distribution. Example: the following sample data set lists the number of minutes 50 internet subscribers spent on the internet during their most recent session.