QMS 102 Lecture Notes - Lecture 1: Ryerson University, Design Of Experiments, Pie Chart

23 Oct 2017
School
Department
Course
Professor
Document Summary
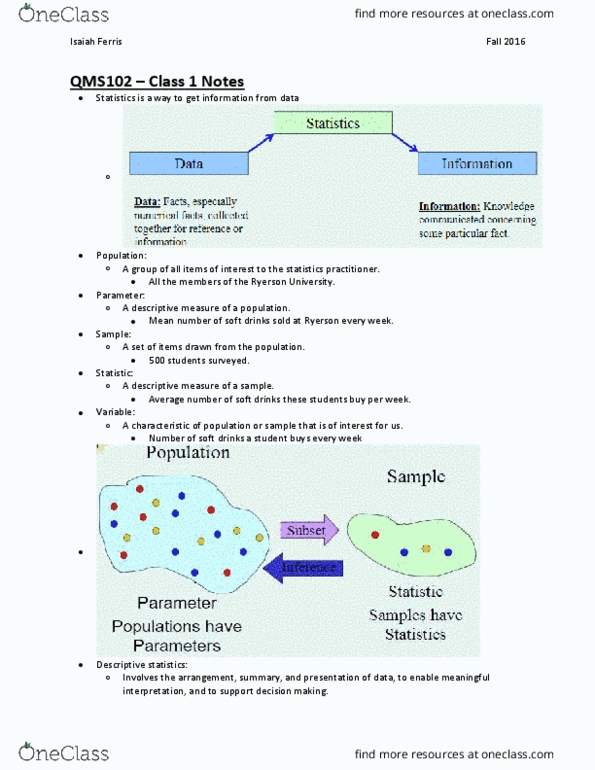
2017-09-11 6:05:00 pm: statistics is a way to get information from our data, a tool for creating a new understanding from a set of #s. Population: group of all items of interest to the statistics practitioner: all members of ryerson university. Parameter: a descriptive measure of a population: mean number of soft drinks sold at ryerson every week. Sample: a set of items drawn from the population: 500 students surveyed. Statistic: a descriptive measure of a sample: average number of soft drinks these students buy per week. Variable: a characteristic of population or sample that is of interest for us: number of soft drinks a student buys every week. In business, statistics helps: transform numbers into useful info for decision makers, quantify & identify the risks in a business decision, understand and reduce the variation in a decision making process. Inferential statistics: using data collected from a small group to draw conclusions about a larger group: estimation: ex.