QMS 102 Lecture Notes - Lecture 3: Categorical Variable, Central Tendency, Percentile

30 Jan 2017
School
Department
Course
Professor

Document Summary
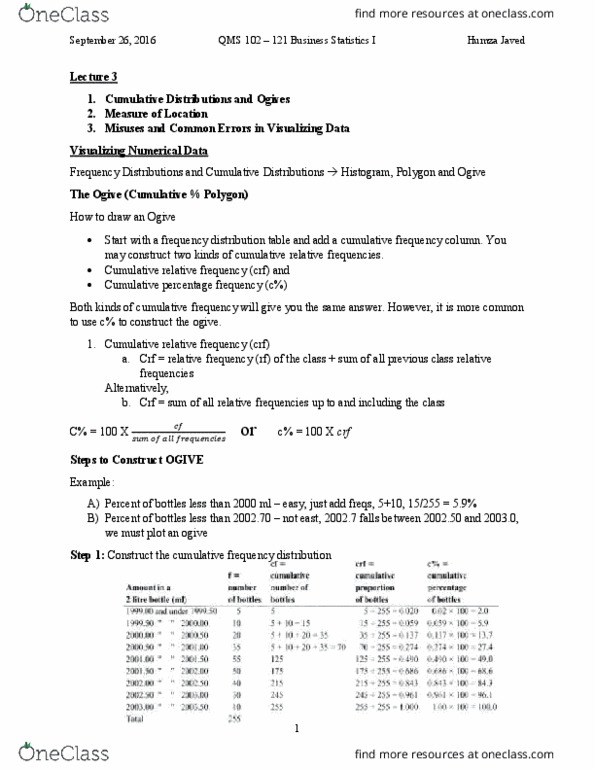
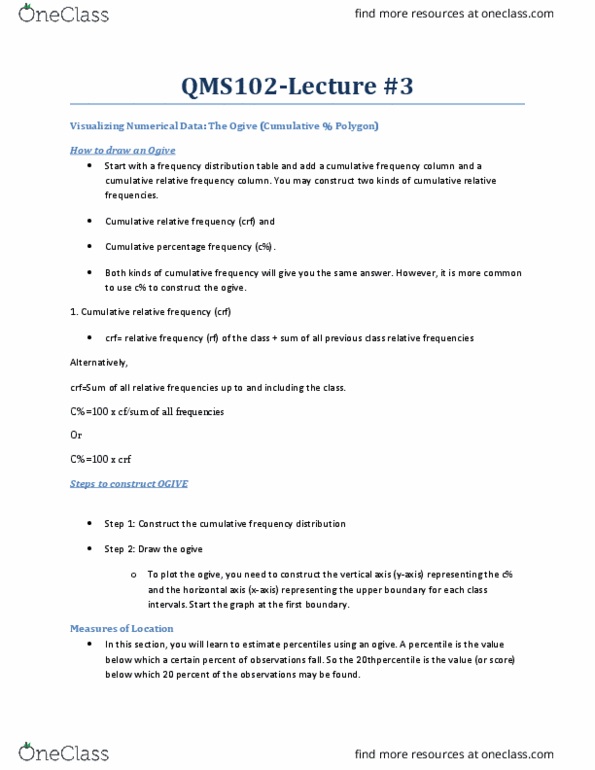
Week 3 statistic lecture graphical techniques for numerical data, measure of. Percentage polygon is formed by having the midpoint of each class represent the data in the class and then connecting the sequence of midpoints at their respective class percentage. Cumulative percentage polygon or ogiven, displays the variable of interest along the x-axis and the cumulative percentage along the y-axis. Useful when there are two or more groups to compare. Cumulative percentage frequency (c%) = 100*crf - = 100*cf / (sum of all frequencies) A percentile is the value below which a certain percent of observations falls. Step 1: arrange the data into ascending array. Half round means rounds to the nearest half. Pk=xr (if the rank is an integer) or =xr-0. 5+xr+0. 5/2 (if the rank is a fractional half) Xr denote the observation value corresponding to the rank (r) 90th percentile is larger than 90% of observations. N is the number of observed values.