GMS 401 Lecture Notes - Lecture 8: Statistical Process Control, Control Chart, Type I And Type Ii Errors

7 Mar 2016
School
Department
Course
Professor
Document Summary
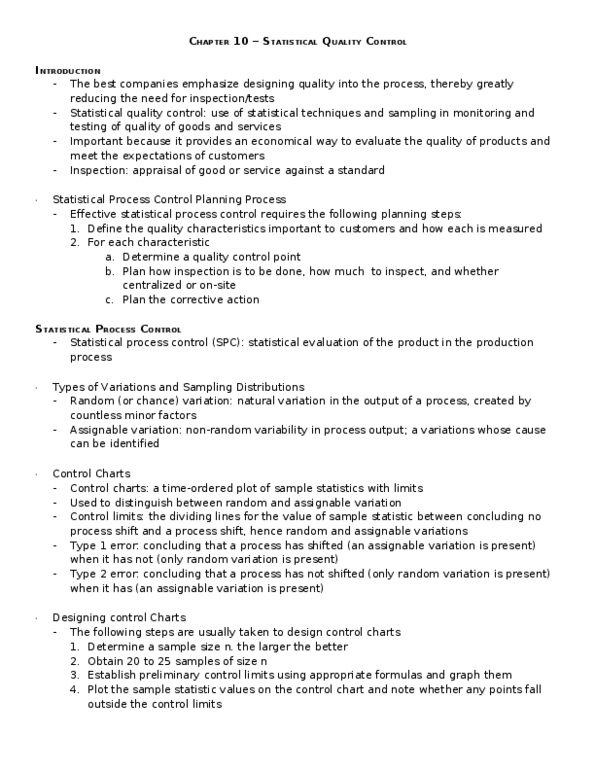
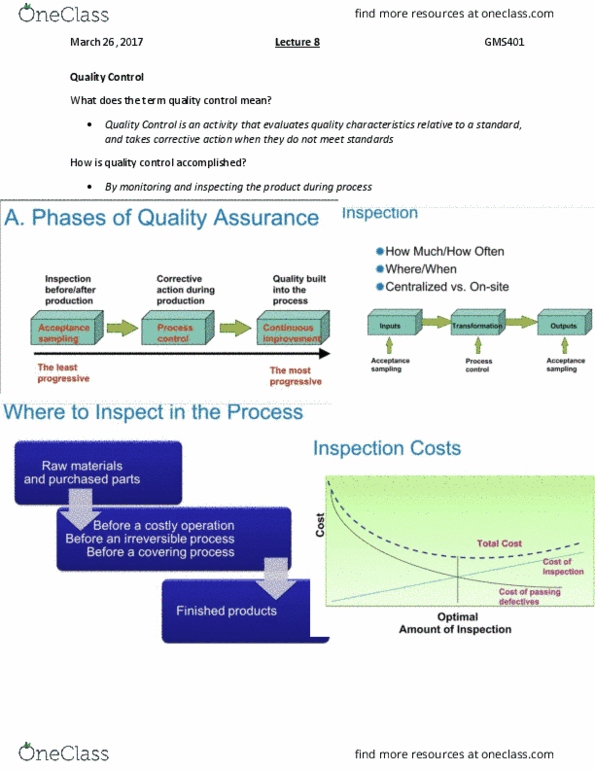
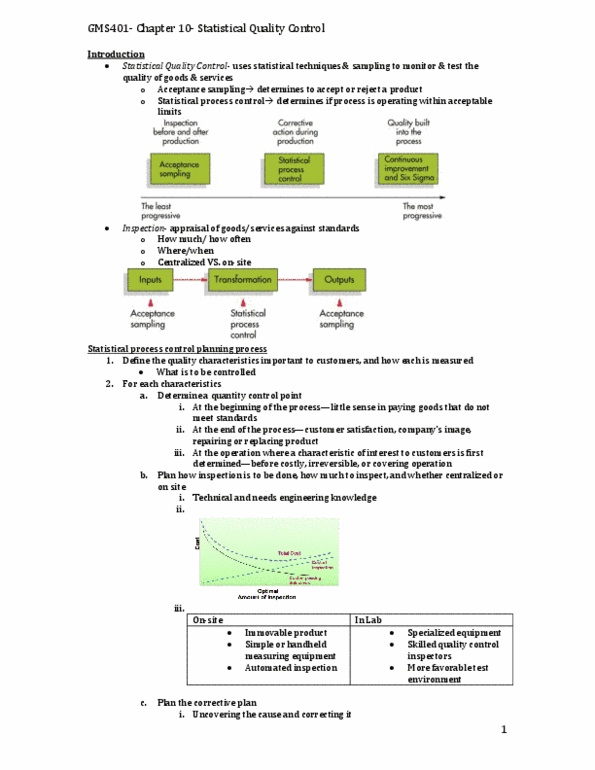
List and briefly explain the elements of the statistical process control planning process. Explain how control charts area designed and the concepts that underlie their use, and solve problems that involve control chart design and use. Assignable variation (special variation): non-random variability in process output; a variation whose cause can be identified. C-chart: control chart for sample number of defects per unit product, used to monitor the number of defects per unit product. Control chart: time ordered plot of a sample statistic between concluding no process shift and a process shift, hence random and assignable variation. Design of experiments: performing experiments by changing levels of factors to measure their influence output and identifying best levels for each other. Design specification: a range of acceptable values established by engineering design or customer requirements. Individual (x) control chart: control chart of individual unit, used to monitor single observations (n=1) Inspection: appraisal of a good or service against a standard.