BIOL 243 Lecture Notes - Lecture 11: Complement Factor B, Analysis Of Variance, Box Plot

17 Nov 2016
School
Department
Course
Professor

Document Summary
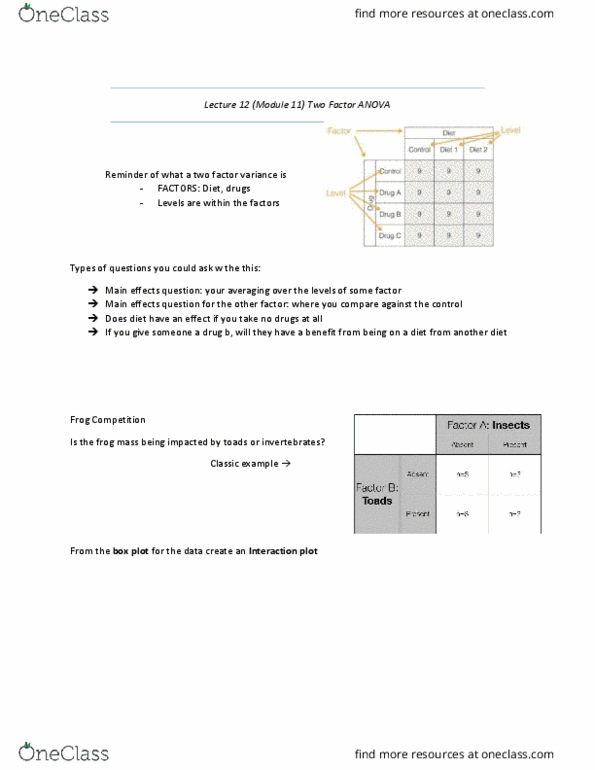
Lecture notes included in separate document (mine is on thursday) Factor and levels (example: diet = factor, diet 1,2,x = levels. Is there an effect of factor a: known as the main effects factor a . Is there an effect of factor b: known as main effects factor b . Does the response to factor a depend on factor b: known as interaction questions. When looking at main effects, look at two columns or rows and compare their means. Use of boxplot can be used to visualize the two-factor anova: graphing along a single factor makes it difficult to see the main effects and interactions. Better to graph an interaction plot: x-axis is one factor, symbols or lines are the other, used to organize and visualize with ease. Left (boxplot), right (interaction plot: use of averages. Use of these charts to construct a variation table. Ss, is the sum of squares df, is the degrees of freedom.