STATS 2B03 Lecture Notes - Standard Deviation, Probability Plot

19 Jun 2013
School
Department
Course
Professor
Document Summary
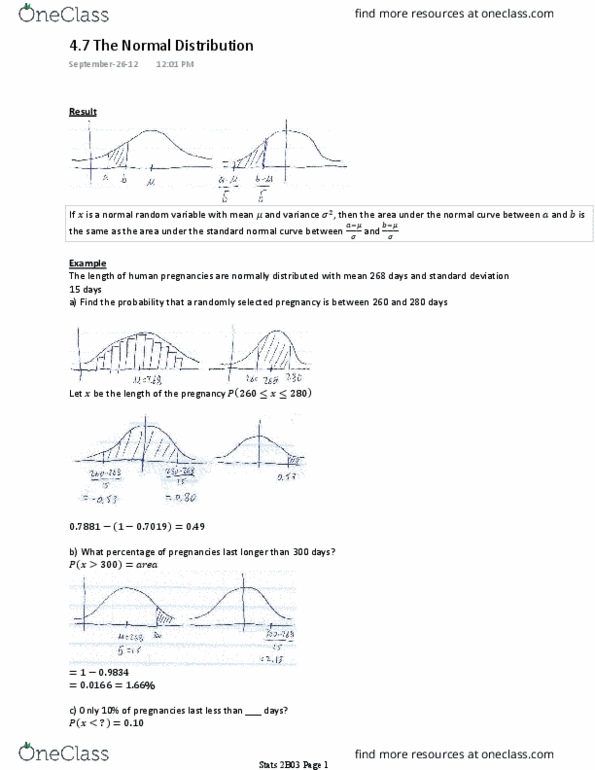
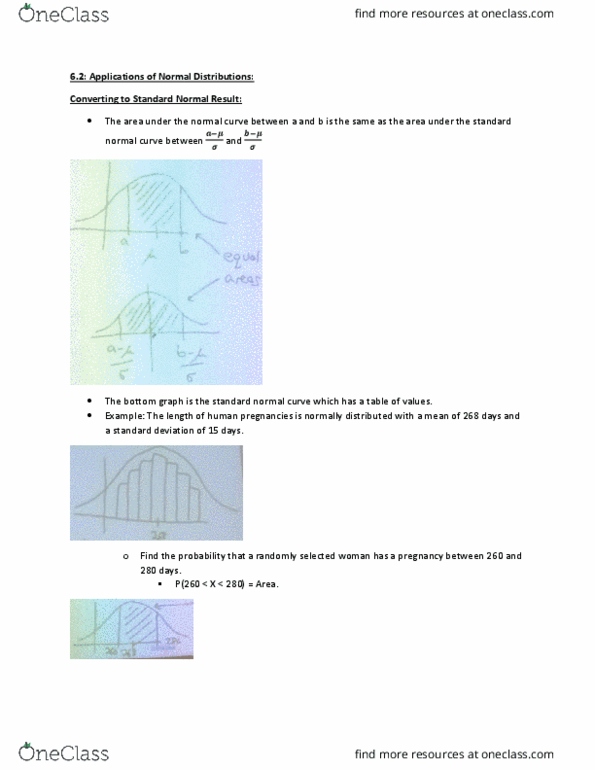
Result: if x is a normal r. v. with mean and variance 2 then the area under the normal curve between a and b is the same as the area under the standard normal curve between. =1. 66: only 10% of pregnancies last less than ? days. Example: suppose that marks on a test are normally distributed with =75. Find if 15% of the class got over 90. Given a population of values we can draw a histogram to see if the population follows a normal distribution. Given a sample of values, how do we determine if the population follows a normal distribution. Notation: let z be the value z with the property that the area unse the standard normal curve to the left of z is equal to : if =. 05. Let x1, x2, , xn be a given data set and let x(1), x(2), , x(n) be the same data set, but ordered from smallest to largest.