LABRST 3A03 Lecture Notes - Lecture 2: Family Reunification

26 Sep 2017
School
Department
Course
Professor
Document Summary
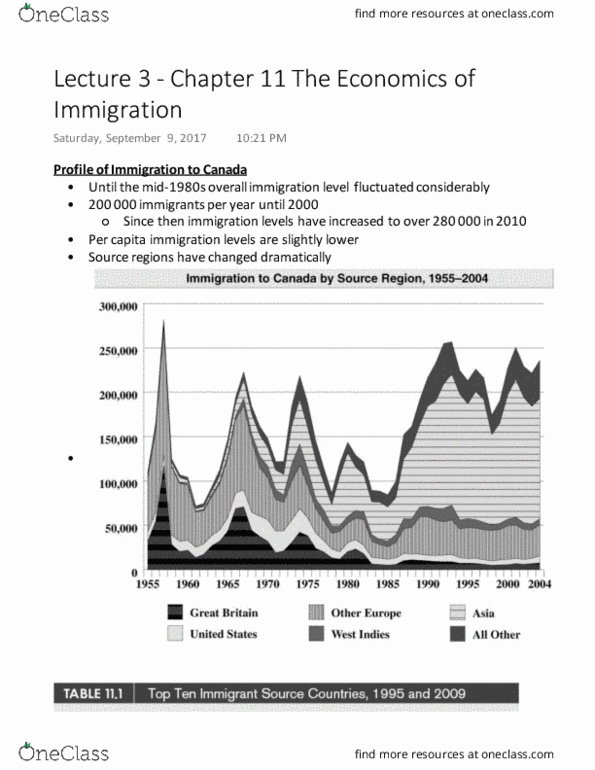
Profile of immigration to canada: u(cid:374)til the (cid:373)id (cid:1005)(cid:1013)(cid:1012)(cid:1004)"s o(cid:448)erall i(cid:373)(cid:373)igratio(cid:374) le(cid:448)els flu(cid:272)tuated (cid:272)o(cid:374)sidera(cid:271)l(cid:455, 200,000 immigrants per year until 2000. 280,000 in 2010: per capita immigration levels are slightly lower, source regions have changed dramatically. Graph- before the 1980 he levels or more cyclical, and the immigration level was higher. After the 1990s it was more stable. The source region has changed, before immigrants mostly came from uk, us and other. By 1990s the majority source region was asian countries. The policy environment: t(cid:449)o (cid:862)le(cid:448)ers(cid:863, number of immigrants, who is admitted among the potential immigrants, canadian immigration policy has been driven by both the self-interested and the humanitarian concerns.